Dashboard
The rWeb dashboard is the main page shown when you first log into rWeb. From here, you can view information about alerts, current traffic, and zones currently under attack.
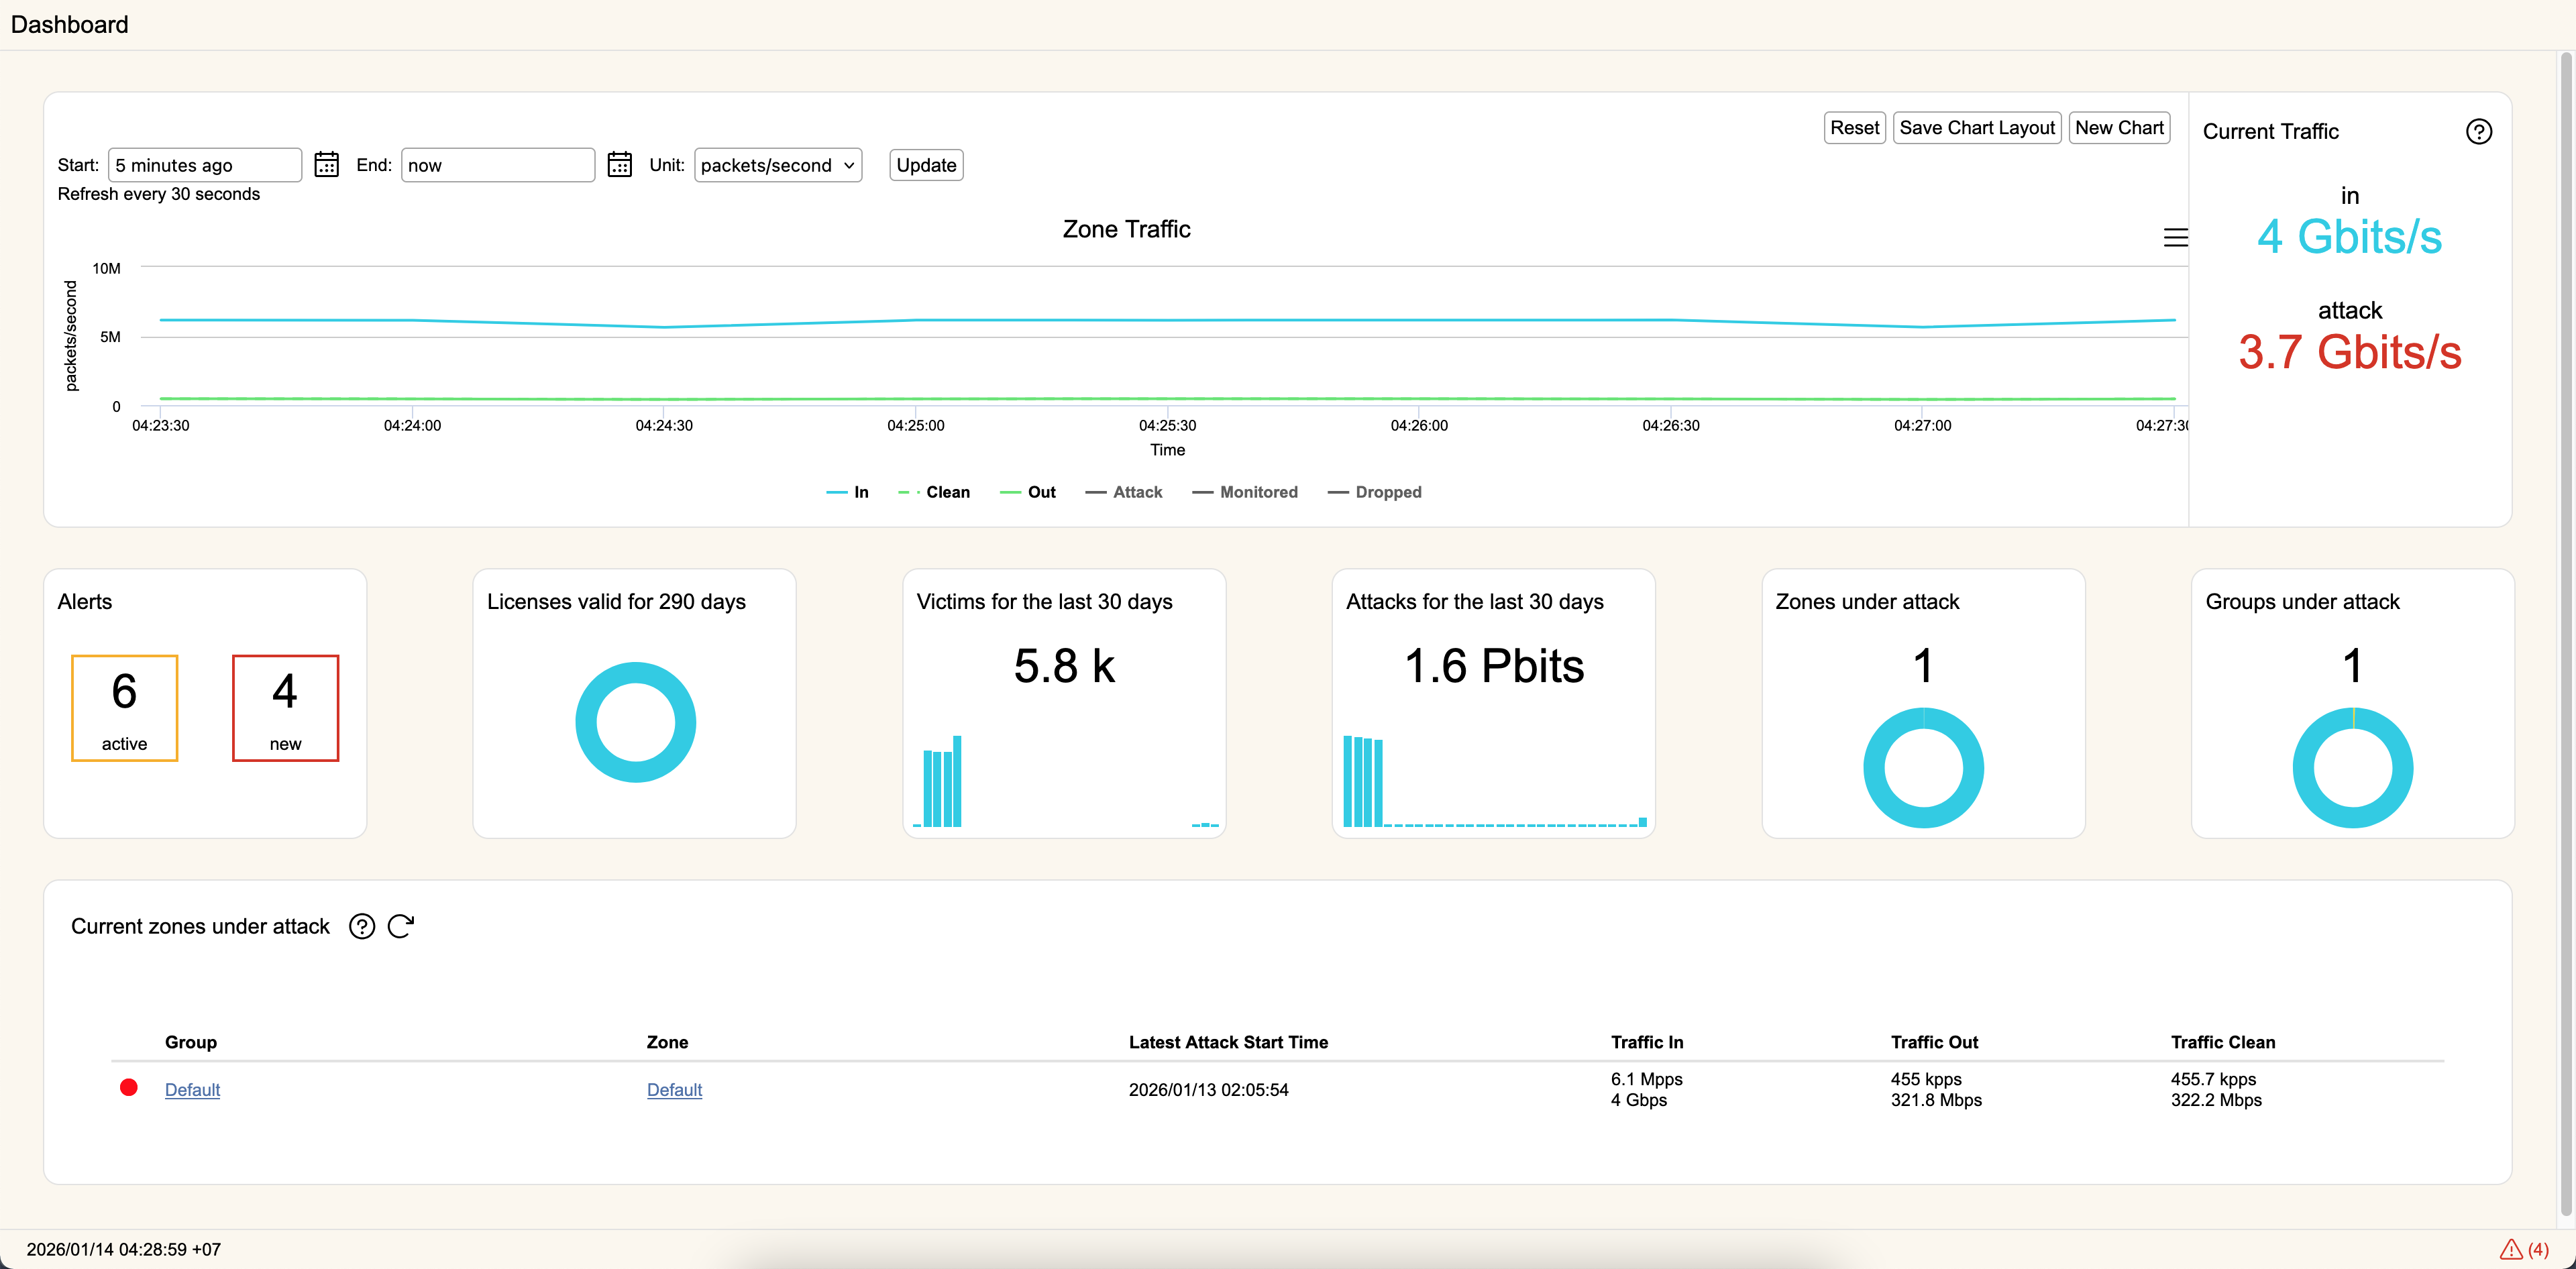
Zone Traffic
This section displays total inbound traffic (WAN side of the filter devices) for all zones visible to your user (requires mitigation reporting read).
Alerts
This section displays active and new alerts. New alerts are any active alerts that haven't been acknowledged.
Licensing
This section shows the current license status of rWeb and all devices connected to rWeb. Red indicates expired licenses, yellow indicates licenses expiring in the next 90 days, and blue are licenses with expirations greater than 90 days.
Victims/Attack for the last 30 Days
These two sections show a simplified bar chart for the number of unique victims and total attack volume (in bits) identified over the past thirty days.
The total number represented will be all victims/attack traffic over the past 30 days. In certain cases, bars may not be shown for dates if the ratio between the maximum and minimum values is too high. In the example screenshot above, there are only a few victims at the end of the month, but they had a much higher percentage of attack traffic, which is why there are no bars in the victims chart but several in the attack chart towards the end of the 30 day period.
Zones/Groups Under Attack
This section shows the total number of groups and zones currently under attack.
Recent Zones Under Attack
This section displays a list of zones that are currently under attack. Clicking on the Group name will bring you to the information page for that Group. Clicking on the zone name will bring you to the mitigation status tab for that zone.