Director Traffic
Go to Administration in the Top Menu > Directors, then select Director Traffic on the left sidebar.
This tab allows you to view network traffic from the perspective of the selected Director. Where most queries using the Director CLI show the max or average as a single value over a selected period, the charts on this page graph these values over time ranges, allowing for better historical visualization of traffic.
Basic Controls
Start and End are the times used to create the chart in each section. You can use the icon to select a specific date and time, or you can write an entry in the format "X year/month/week/day/hour/minute ago", or use "now" to indicate current time. You can use the mouse to click and drag on the chart to zoom in to sections of the chart without having to set a new time period. Click Reset Zoom to bring it back to the original settings.
For every view except Interface Metrics, a selection box with a search filter and dropdown button presents the full tree of Groups and Zones (similar to what is shown in Zone Control). All queries will be run against the selected set of Groups and Zones. If a group and all of its descendants are selected, it will be displayed with the icon. This is equivalent to using a Director group-id-recursive mapping on that Group ID. Selections without that icon are normal Zones (equivalent to a zone-id mapping). To disambiguate between Groups and Zones that may be named identically, hovering over a selected entry will show its type (Group or Zone), unique ID, and name. Entries can selected in the dropdown (opened by clicking the dropdwon button), and dismissed by unchecking them in the dropdown or clicking them in the selection box. Using the search filter will automatically open the dropdown with the set of Groups or Zones that match the search.
Below that are the Method, Type, and Unit dropdowns:
- Method can be either Max or Average. Max will frequently be more useful when trying to determine Director Workflow Triggers, but Average is helpful when trying to get a sense of normal traffic. For Aggregate Metrics, an additional Sum method is provided. This will total the requested traffic acrosss all selected Groups and Zones.
- Type is used to set the type of traffic shown. This maps to the Traffic Type used by Director.
- Unit is the unit of measure for the selected traffic. You can choose between Packets (packets per second) or Bits (bits per second).
Update will refresh the graph (this will be done automatically if you change the Method, Unit, or Type dropdowns). Unlike the charts on Zone Traffic Summary, Director charts won't automatically refresh periodically if End is set to "now".
Each chart has an Export icon (three bar icon). When using Export, you can immediately print the chart or export it to a variety of graphics formats.
Aggregate Metrics
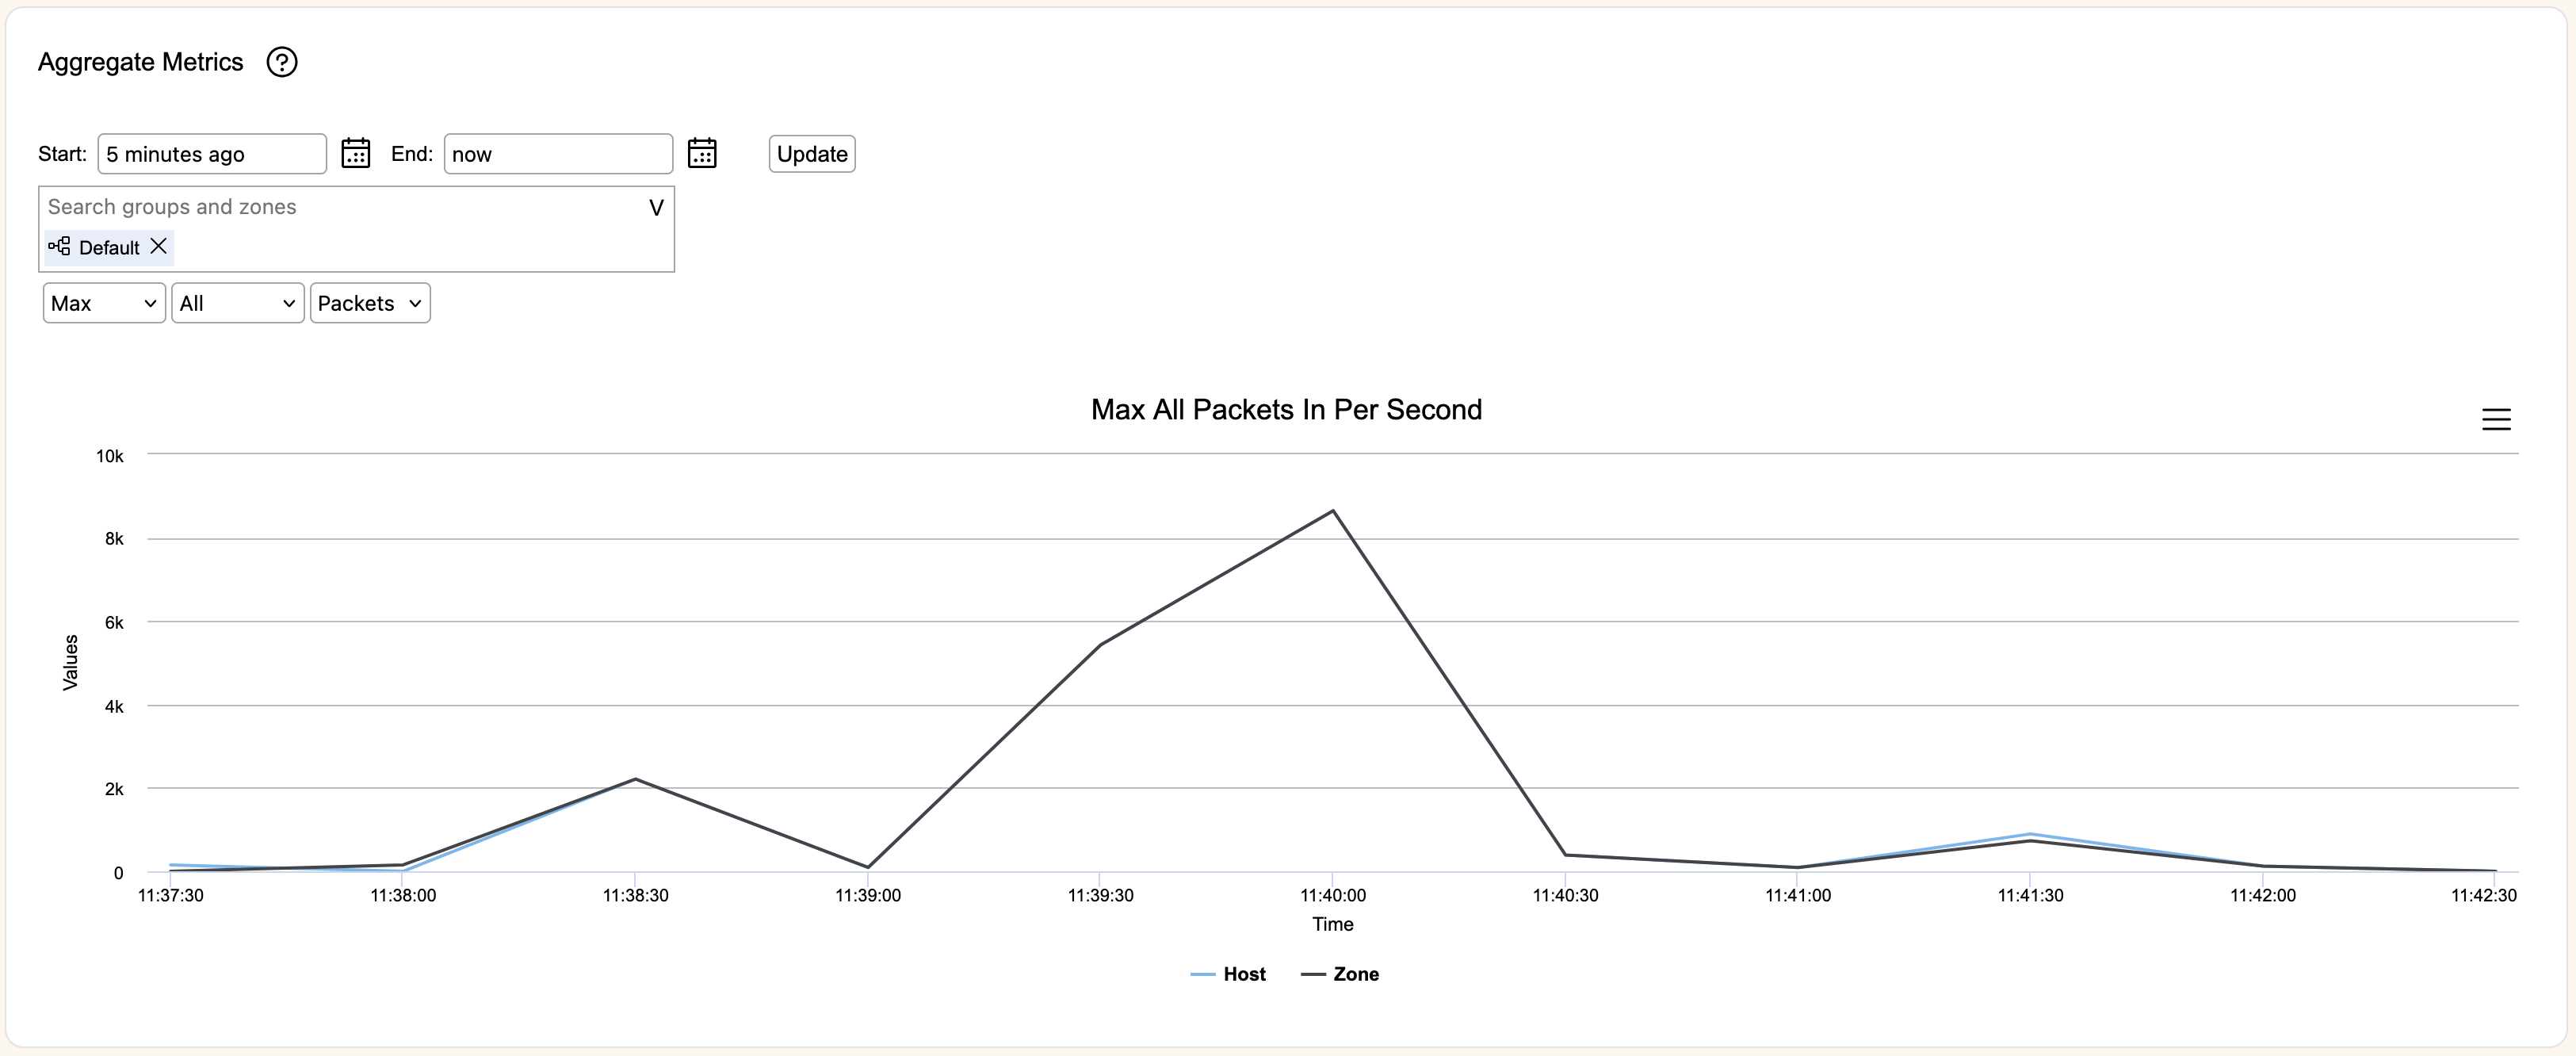
Aggregate Metrics presents the Zone and Host views of the selected Groups and Zones. This is equivalent to running per zone and per host traffic queries for a mapping containing the same set of Zones.
Zone Metrics
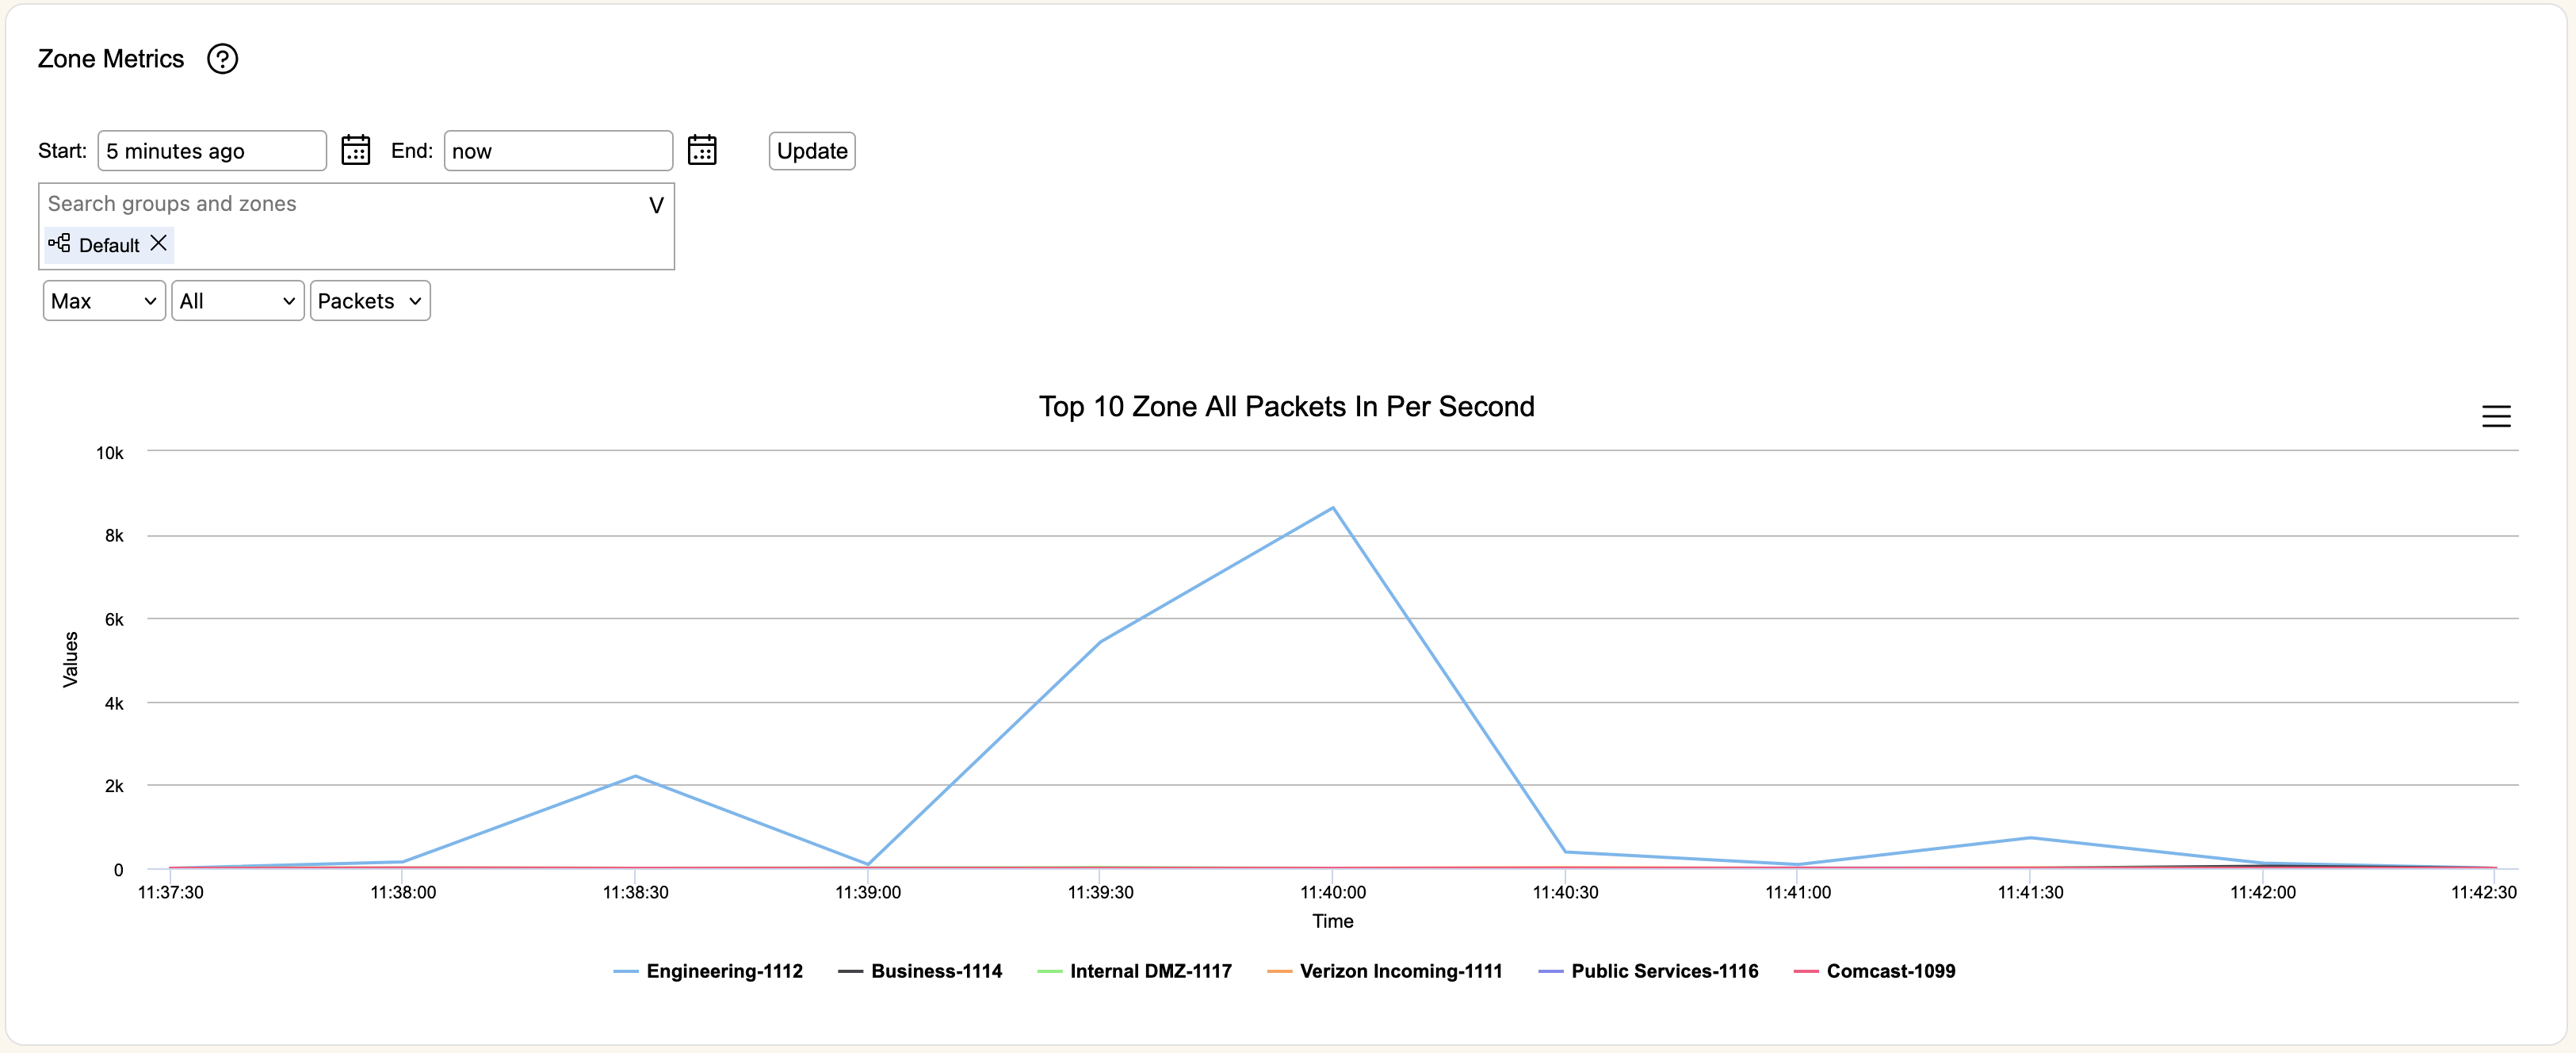
Zone Metrics attempts to present the top 10 Zones across the selected categories. This is equivalent to running a by zone traffic query for a mapping containing the same set of Zones. If there are fewer then 10 Zones, either fewer were selected or some Zones had no data. If the chart is empty, none of the requested Zones had data. Zone series will displayed with their name followed by their unique ID.
Host Metrics
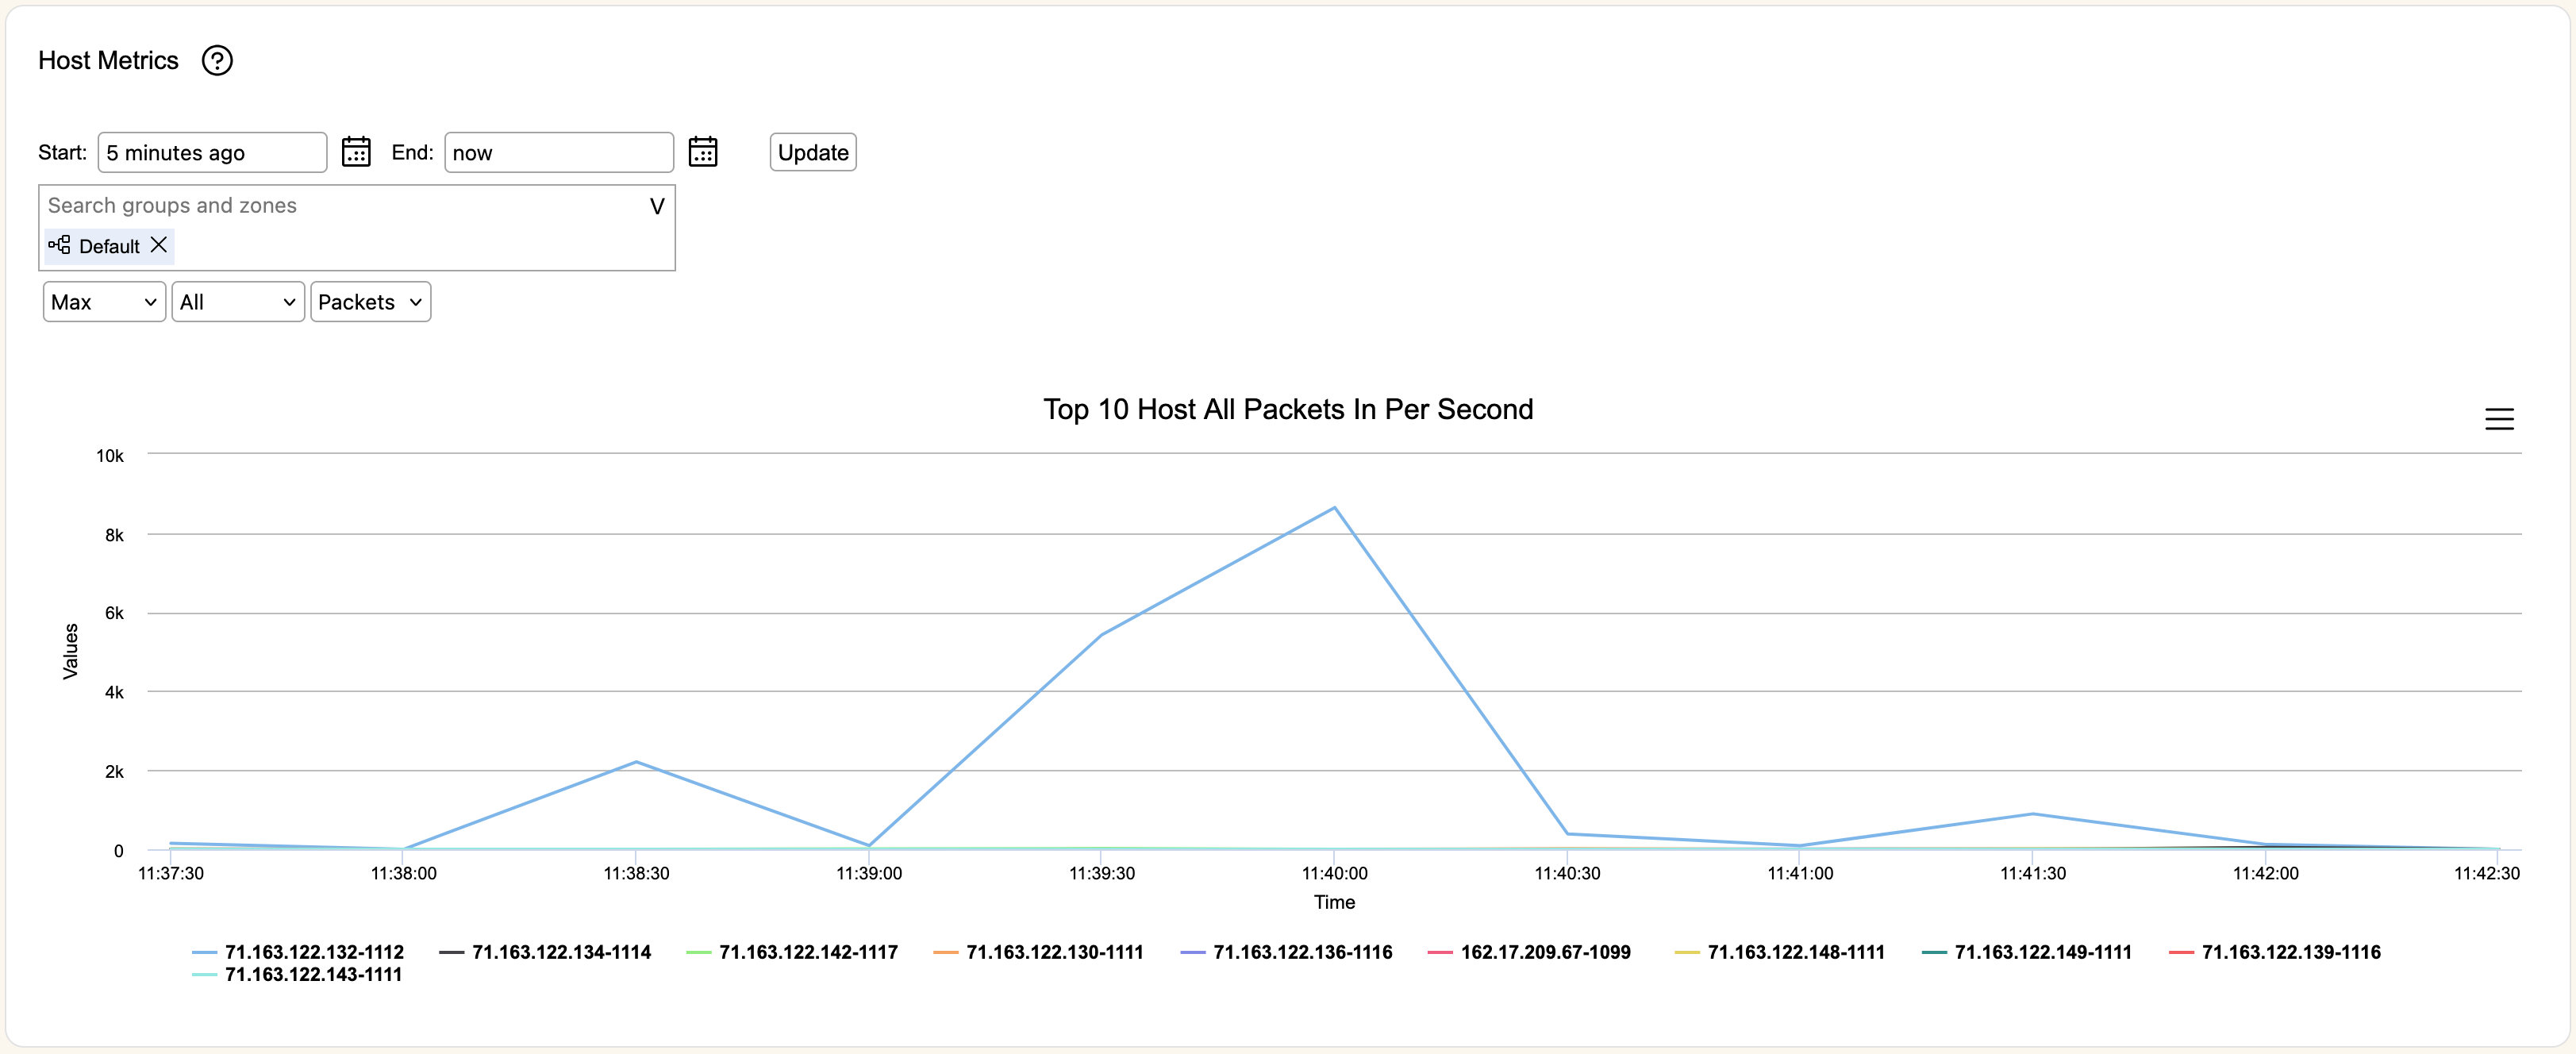
Host Metrics attempts to present the top 10 hosts across the selected categories. This is equivalent to running a by host traffic query for a mapping containing the same set of Zones. If there are fewer then 10 hosts presented, only that many distinct host samples were observed. If the chart is empty, none of the requested Zones had host samples. Host series will displayed with their IP address followed by their Zone ID.
If a host is present twice with different Zone IDs, this means there was an rWeb configuration change that changed which Zone contained that host address. Similarly, it is possible to have a host drop off if it is now in a Zone not requested for the current chart.
Interface Metrics
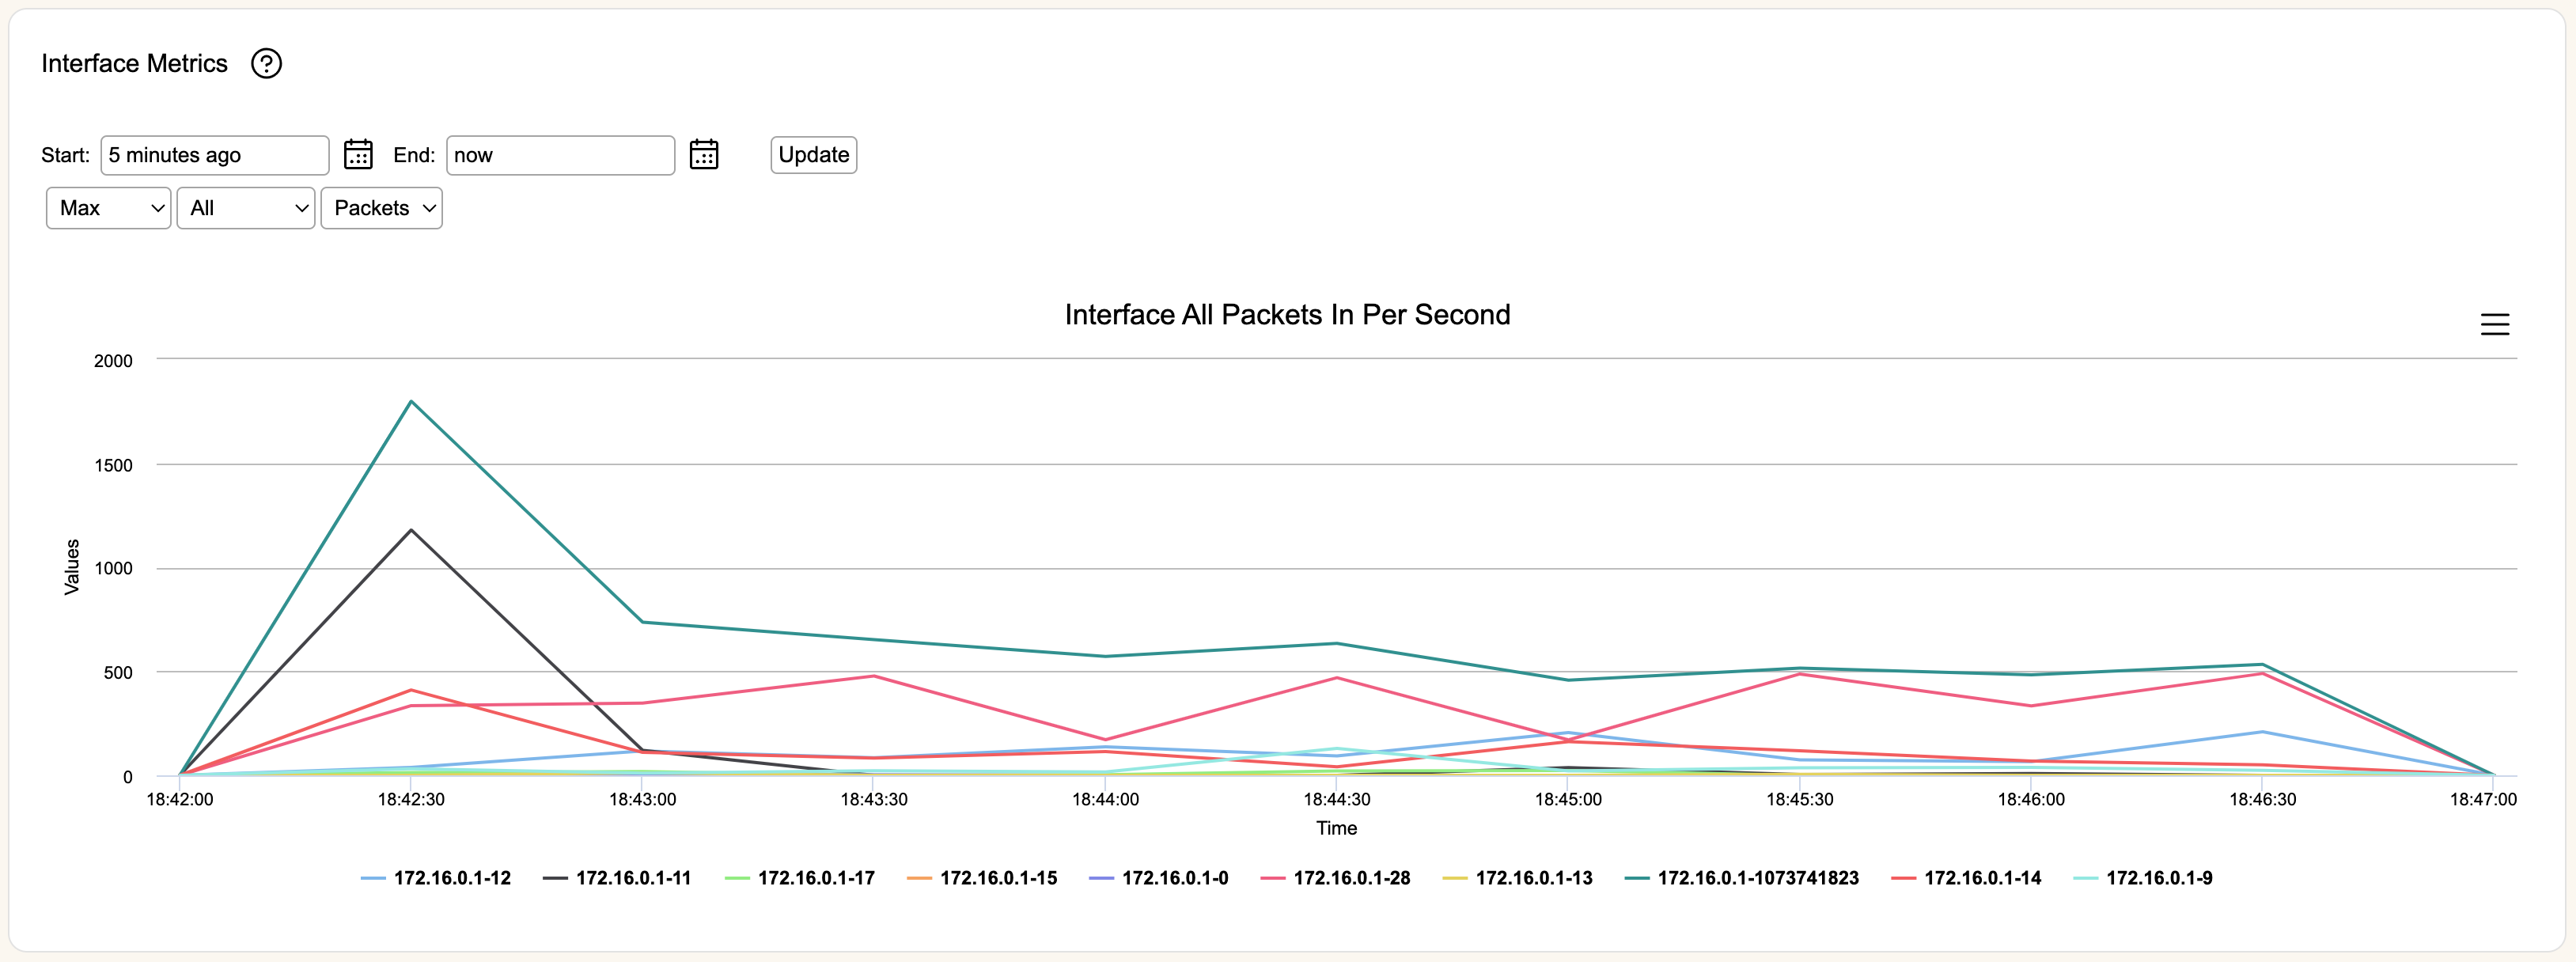
Interface Metrics shows traffic on a source IP and interface identifier (SNMP ifIndex) basis, per network device configured to send flow samples to this Director.
Because ifIndex can change between boots of network devices, the identifiers used in this chart may change over time. If possible, it's recommended to configure your network device to persist their SNMP identifiers (example Cisco documentation here). If monitoring RIOS IPFIX samples, persistence is already configured.