Net Stats
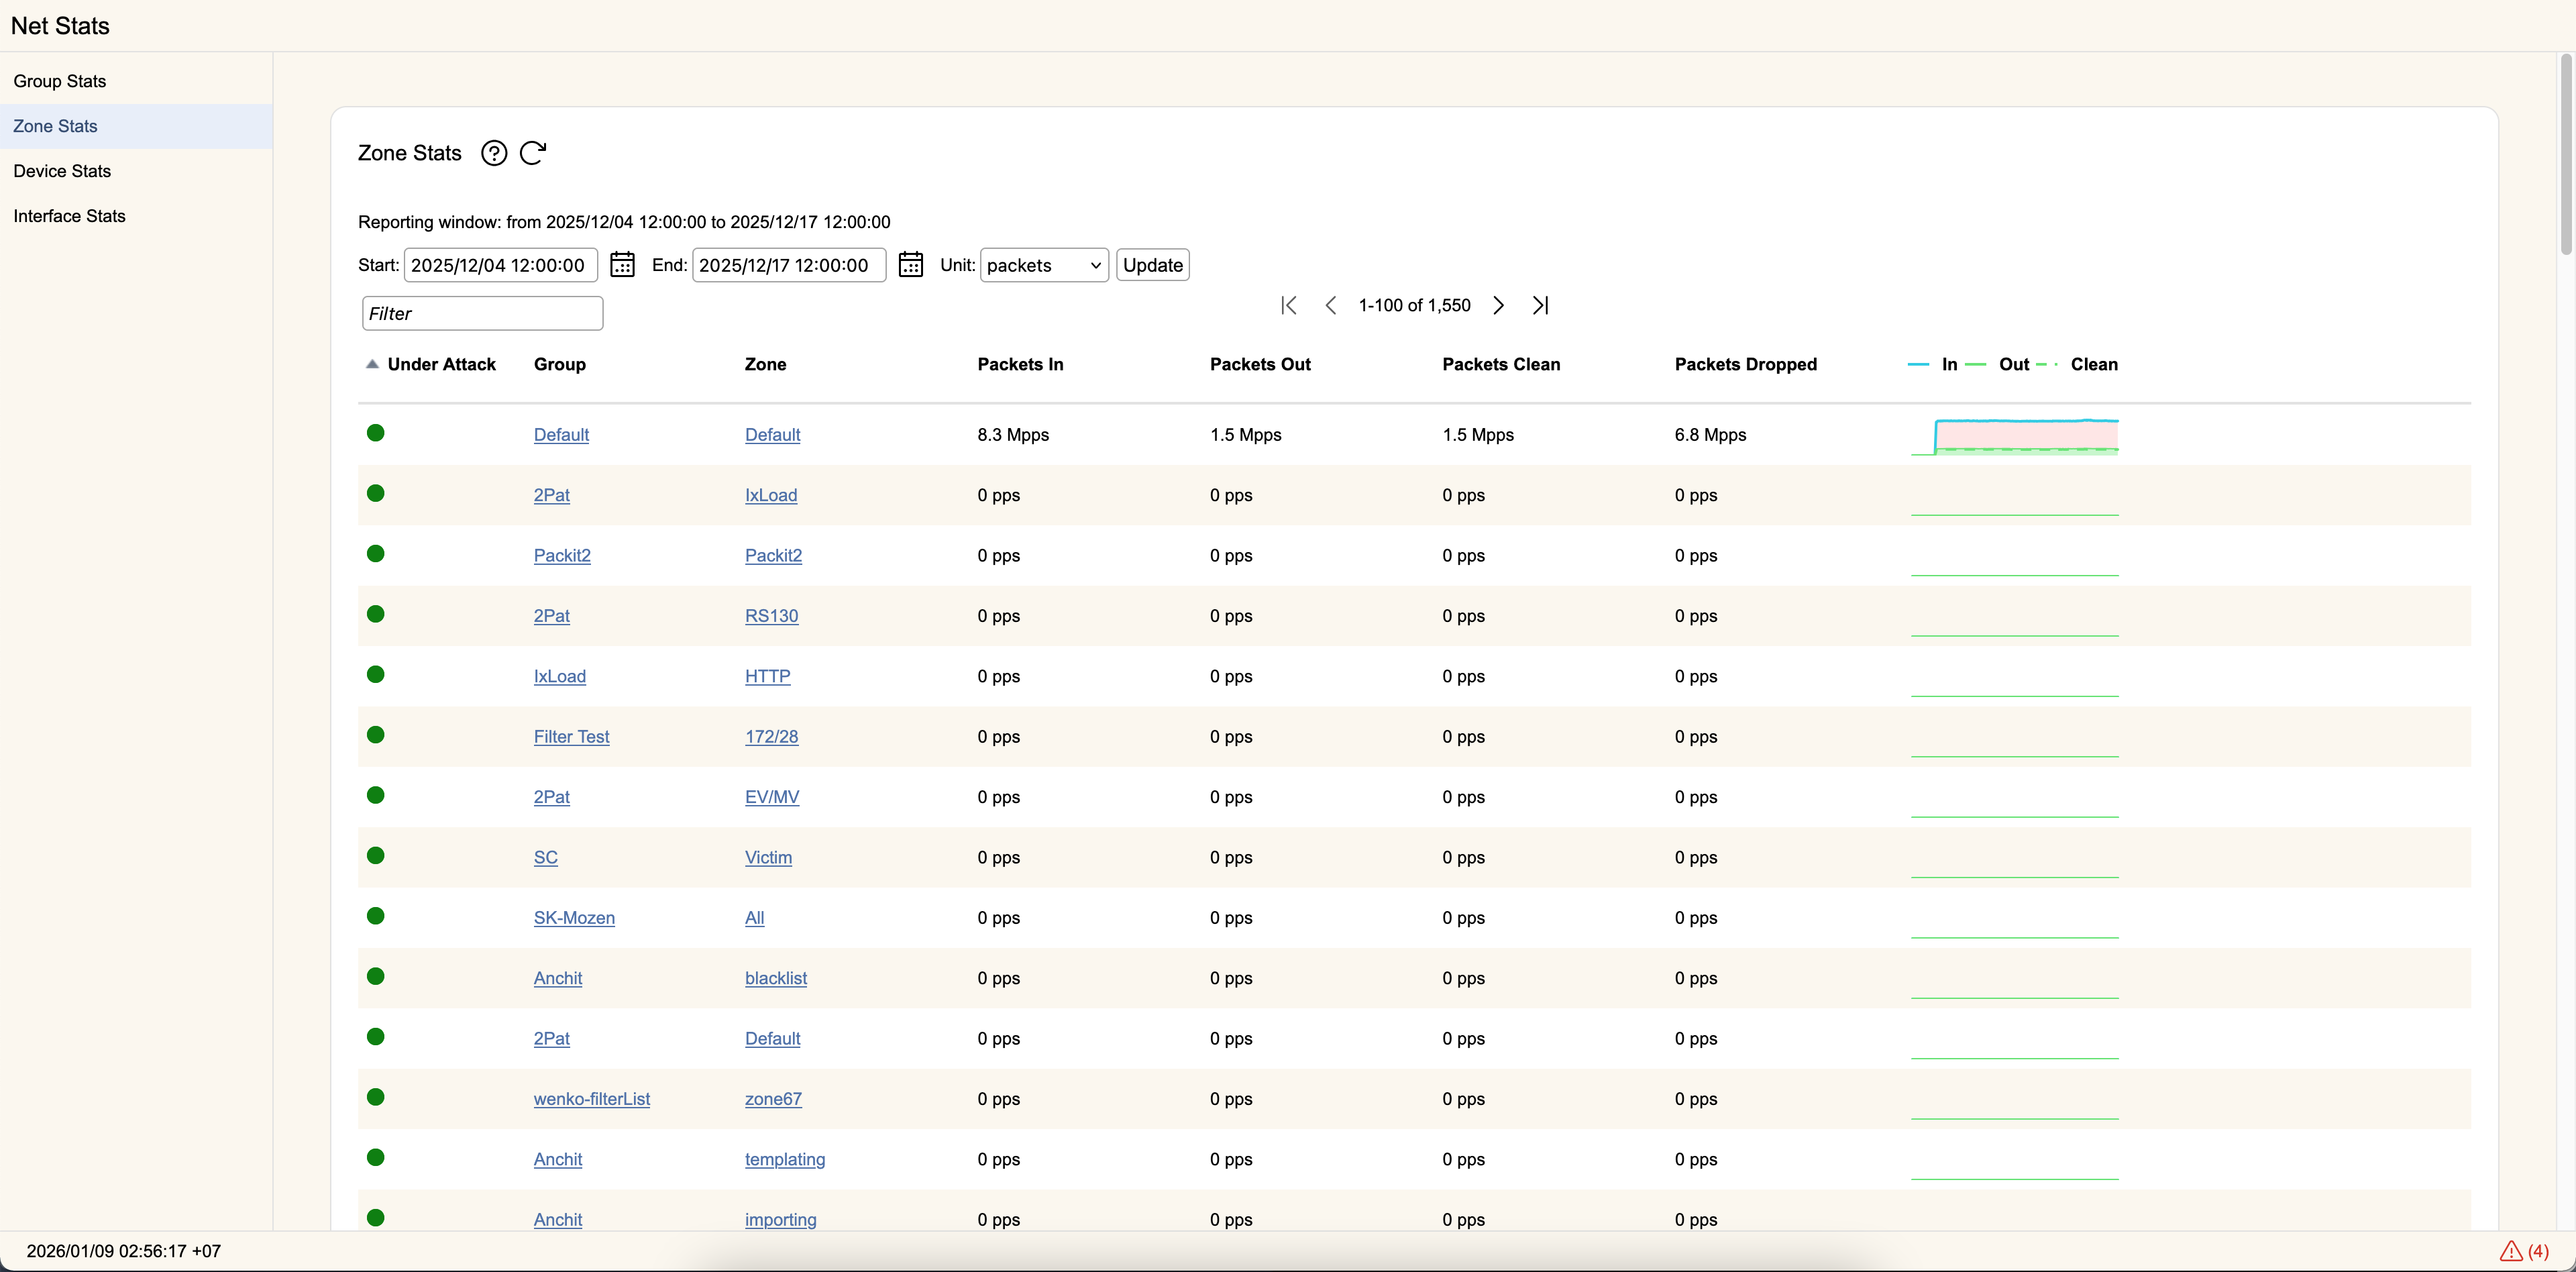
The Net Stats page, accessible from the Top Menu, displays a traffic summary from a variety of perspectives. The common controls are:
History- You can set the time period of the data displayed on this page. You can enter times in the format X (minutes/hours/days/weeks/months/years) ago or in absolute timestamps using the calendar controls.
Detail- You can view the data in either packets or bits per second. You can also set the number of items displayed on each page to 10, 20, or 50 results.
Filter- You can enter text here to filter by items relative to your current perspective.
Pressing Update will refresh the page to display data based on the above settings.
Clicking on any chart miniature will zoom into a larger version of the chart as seen below:
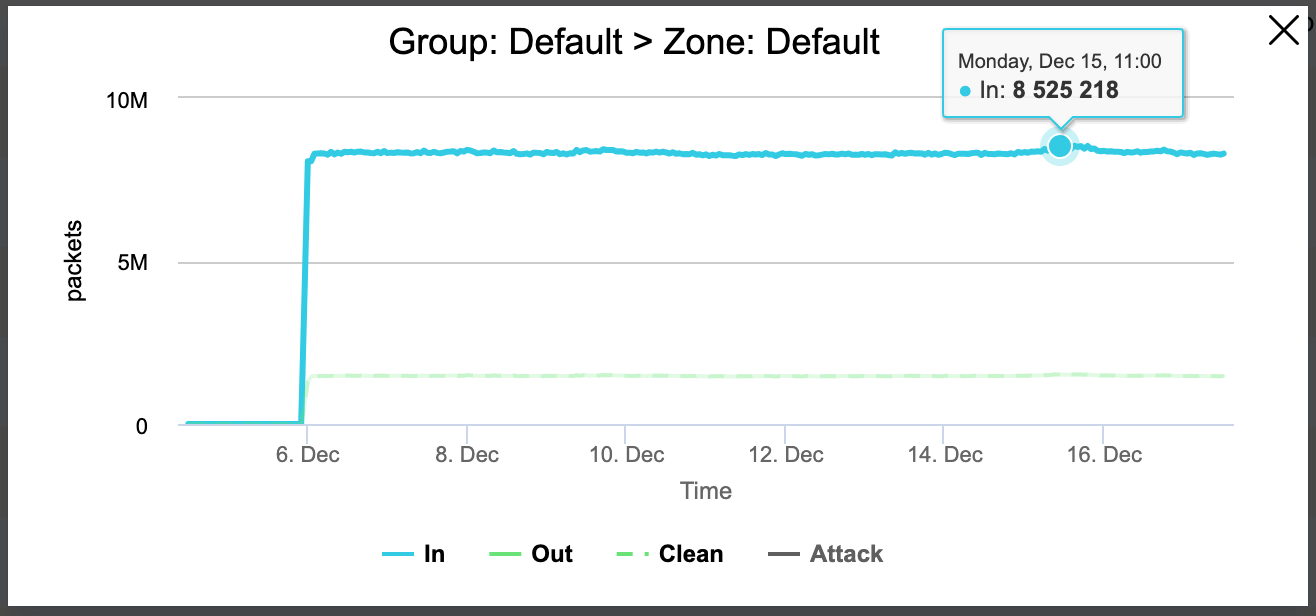
This zoomed in view will be a line chart with the ability to toggle the In, Out, Clean, and Attack categories of traffic.
Net Stats can be displayed using the following perspectives, accessible on the left side of the screen:
Group Stats
Each group in rWeb you have permissions to view will be displayed with the following information based on the controls above:
Group Stats will only show information for zones directly associated with that group. It will not show data based on zones owned by subgroups.
- Under Attack- If any zone directly available within the group is currently under attack, a red light will be displayed. Otherwise, the group will have a green light.
- Name- The name of the Group. If you click on the name, you will be brought to the Group Information tab.
- Packets/Bits In- The packets/bits in as of the End period set under History, using the data unit selected under Detail.
- Packets/Bits Out- All packets/bits out as of the End period set under History, using the data unit selected under Detail.
- Packets/Bits Clean- The packets/bits out that are detected as clean, as of the End period set under History, using the data unit selected under Detail.
- Packets/Bits Dropped- The packets/bits flagged and dropped as attack traffic, as of the End period set under History, using the data unit selected under Detail.
- Graph- A condensed graph of the time period selected, showing total traffic into the zones that are a direct child of this group versus cleaned traffic passed through.
Zone Stats
Each zone in rWeb will be displayed with the following information based on the controls above:
- Under Attack- If the zone is currently under attack, a red light will be displayed. Otherwise, the zone will have a green light.
- Group- The name of the Group who owns the zone. If you click on the name, you will be brought to the Group Information tab.
- Zone- The name of the zone. Clicking on the zone name brings you to that Zone's Mitigation Tab.
- Packets/Bits In- The packets/bits in as of the End period set under History, using the data unit selected under Detail.
- Packets/Bits Out- All packets/bits out as of the End period set under History, using the data unit selected under Detail.
- Packets/Bits Clean- The packets/bits out that are detected as clean, as of the End period set under History, using the data unit selected under Detail.
- Packets/Bits Dropped- The packets/bits flagged and dropped as attack traffic, as of the End period set under History, using the data unit selected under Detail.
- Graph- A condensed graph of the time period selected, showing total traffic into the zone versus cleaned traffic passed through.
Device Stats
Individual devices configured in rWeb will be displayed with the following information based on the controls above:
- Name- The name of the device in rWeb. Clicking the hyperlink will bring you to the summary page for that device.
- IP- The IP address of the device's management interface.
- Connection Status- The current connection status of the device.
- Packets/Bit Rx- The packet/bit rate into the device as of the End period set under History, using the data unit selected under Detail.
- Packets/Bit Tx- All packet/bit rate out of the device as of the End period set under History, using the data unit selected under Detail.
- Graph- A condensed graph of the time period selected, showing total traffic into the device versus cleaned traffic passed through.
Interface Stats
Individual port statistics of filter devices configured in rWeb will be displayed with the following information based on the controls above:
- Name- The name of the device in rWeb. Clicking the hyperlink will bring you to the summary page for that device.
- IP- The IP address of the device's management interface.
- Port- The data plane port on the device. Odd numbered ports will be WAN side (Rx is filtered) and even numbered ports will be LAN side (Rx is always passed through).
- Packets/Bit Rx- The packet/bit rate into the device as of the End period set under History, using the data unit selected under Detail.
- Packets/Bit Tx- All packet/bit rate out of the device as of the End period set under History, using the data unit selected under Detail.
- Graph- A condensed graph of the time period selected, showing total traffic per interface.