Group Information
When a group (not a zone) is selected from the Zone Control menu, you are brought to a tab displaying information about that group.
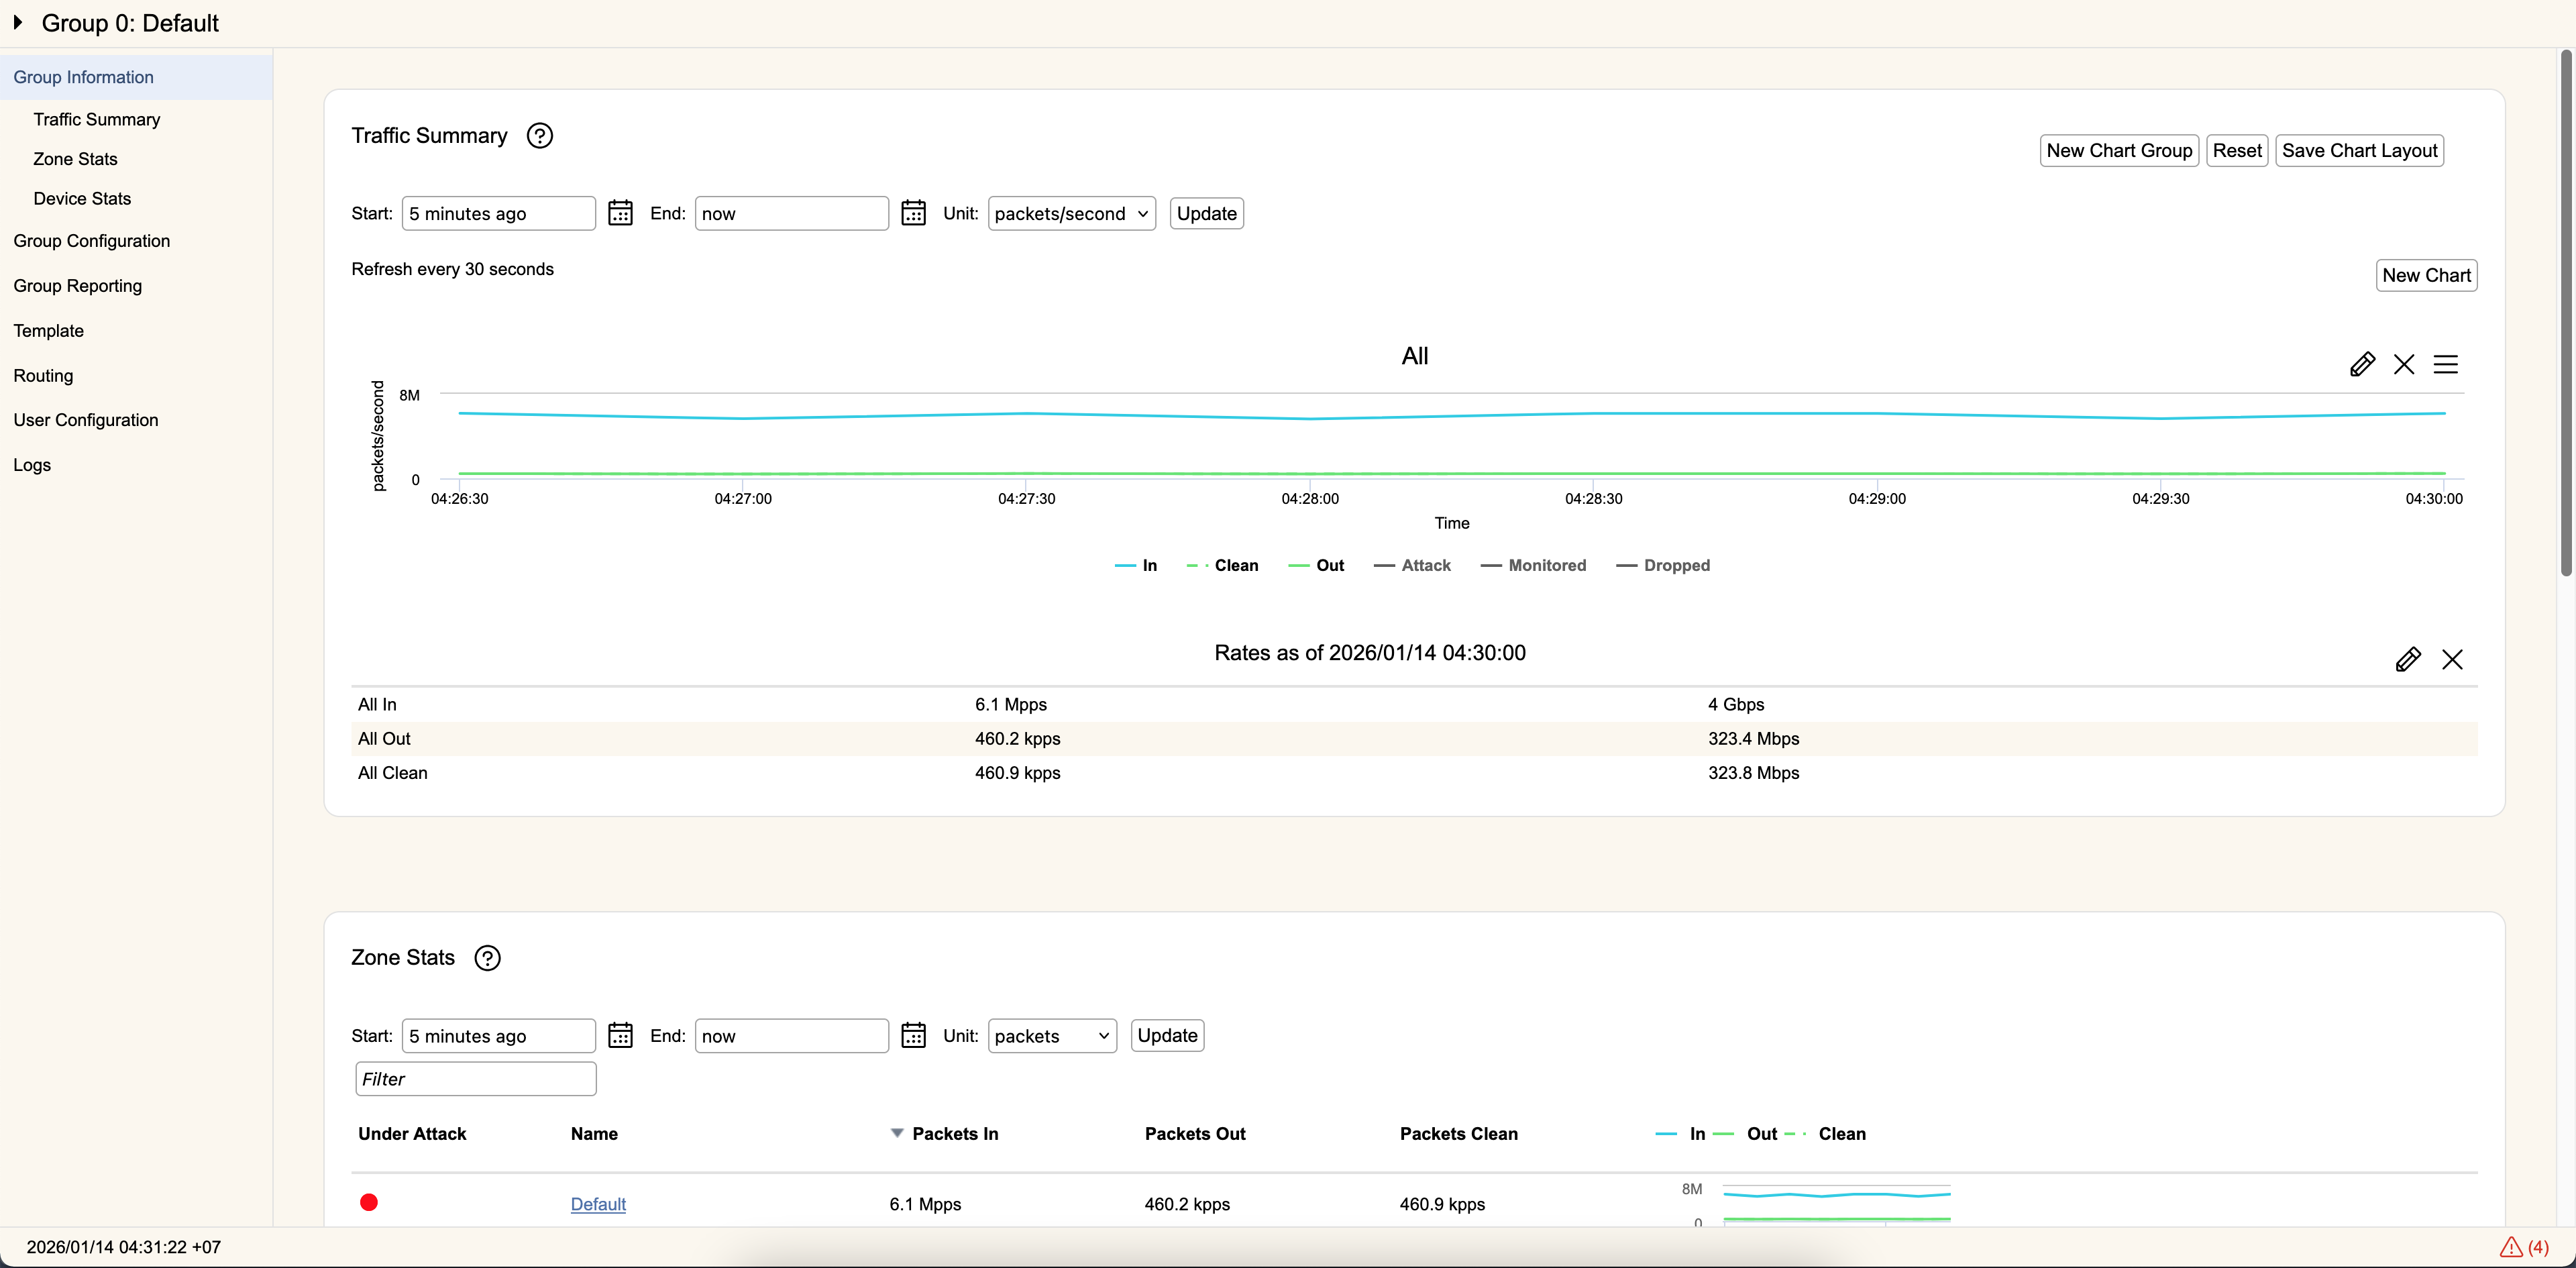
Traffic Summary
This section displays the aggregated traffic statistics for all zones associated with this group. It works exactly the same as the Zone Traffic Summary, other than showing the aggregated statistics rather than those of a single zone.
Zone Stats
This section breaks down the traffic into each individual zone, with data rates and a sparkline graph covering the period between Start and End. You can modify the time period and data units to display in this section. Clicking on the zone name brings you to the Mitigation Tab for that zone.
Device Stats
This section displays each filter device associated with the zone. Besides the device name, address, type, and current version of RIOS, it will also display traffic Received and Sent in both packets per second and bits per second (exact units vary based on traffic). Clicking on the device name (if a link is present) will bring you to the Device Summary tab for that device.