Top VLAN
The Top VLAN section lets you view current or historical Virtual Local Area Network (VLAN) usage.
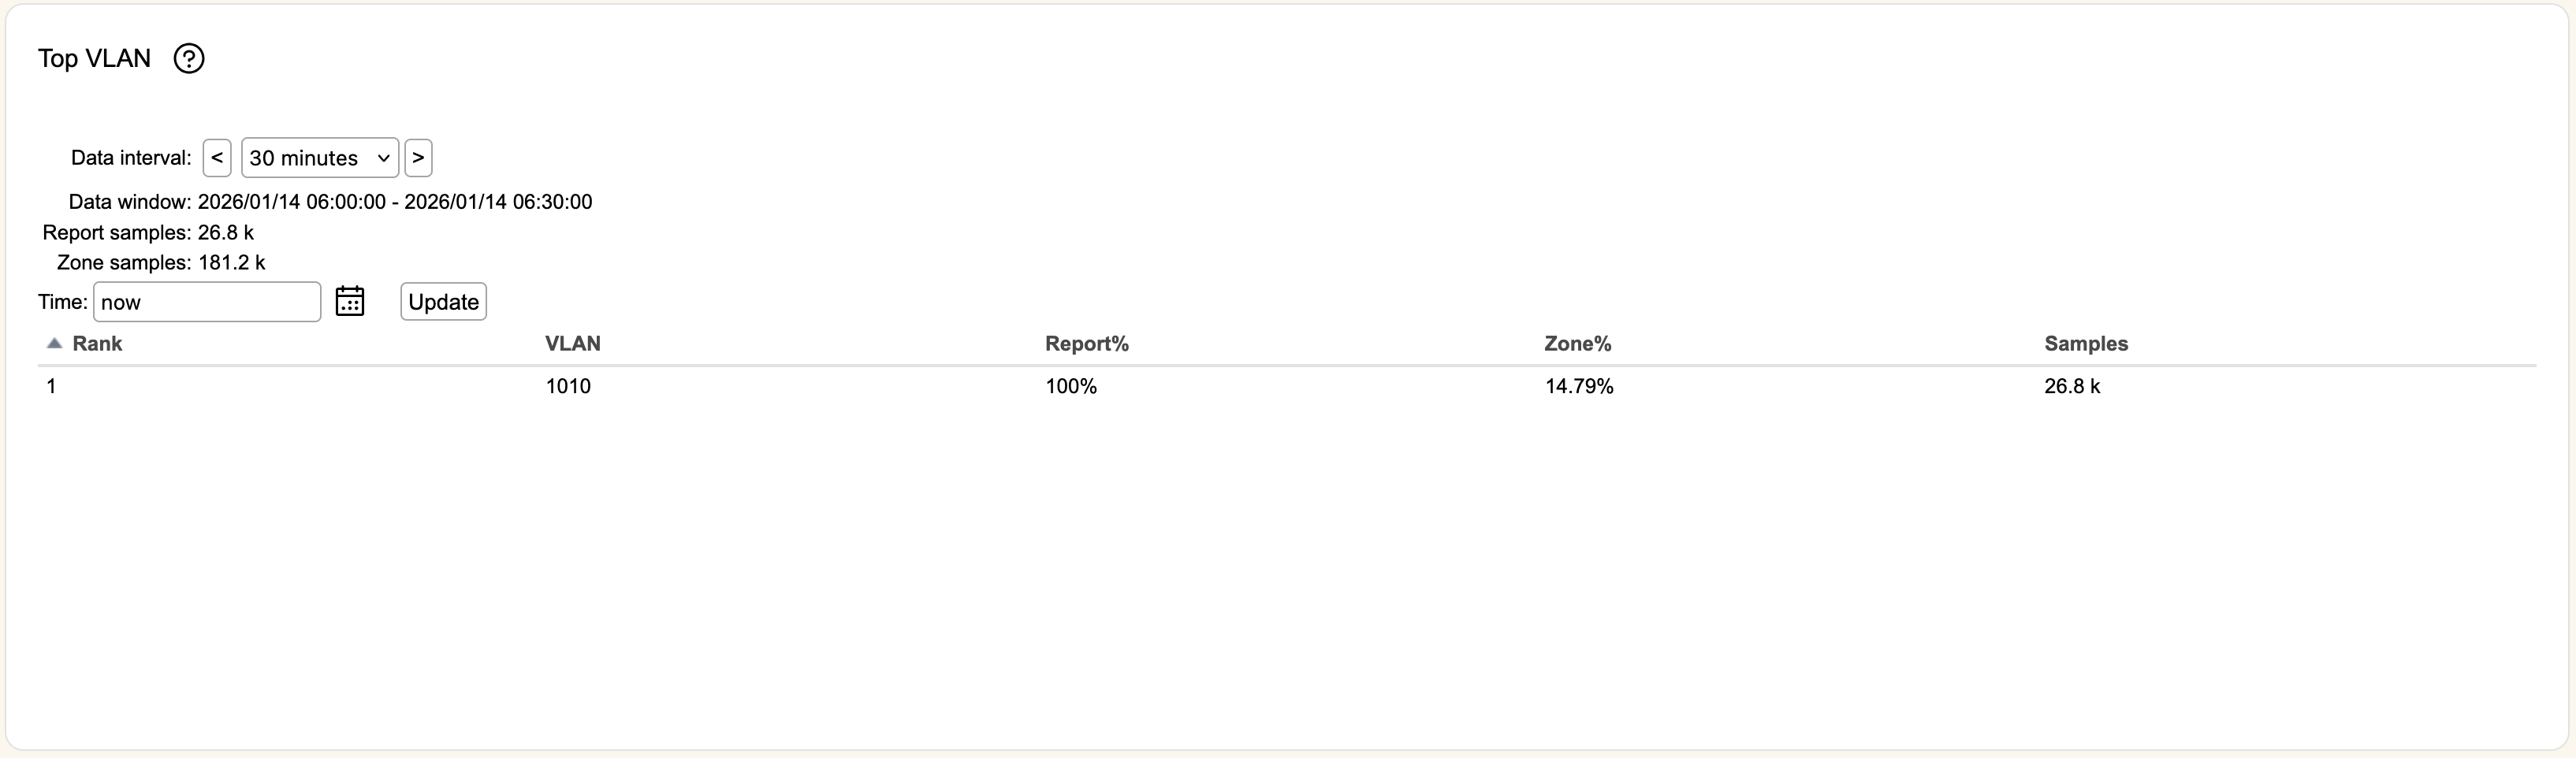
Time is the time period used to find data. You can use the icon to select a specific date and time, or you can write an entry in the format "X year/month/week/day/hour/minute ago", or use now to indicate current time. Once you've entered information, hitting Update will refresh the table.
Data interval defaults to a 30 minute sampling window, but can be changed to 5 minute or 30 second reporting. Clicking the < or > buttons will increment or decrement the window in by the selected interval (versus entering a new timestamp in Time), with its time range shown in Data window.
Rank rates the VLAN usage based on the amount of traffic during that reporting period.
VLAN is the outermost VLAN tag being used for transport. If you have 2 types of packets in a zone, one with nested VLANs 1/2/3, the other with nested VLANs 4/5/6, you'll only see VLANs 1 and 4 reported.
Packets with no VLAN tag will not be reported at all here. In the image above, 100% of the VLAN tagged packets are using VLAN ID 1010, but that only comprises 17.85% of the zone's samples, meaning the other ~82% of samples have no VLAN tag.
Report% and Zone% represents the amount of traffic transported by the VLAN within the selected time period and zone.
The number of packets captured for each entry is shown in Samples.