Traffic Detail
The Traffic Detail section can be configured to display charts specific to session traffic and behavior as tracked by AT8.
Basic Controls
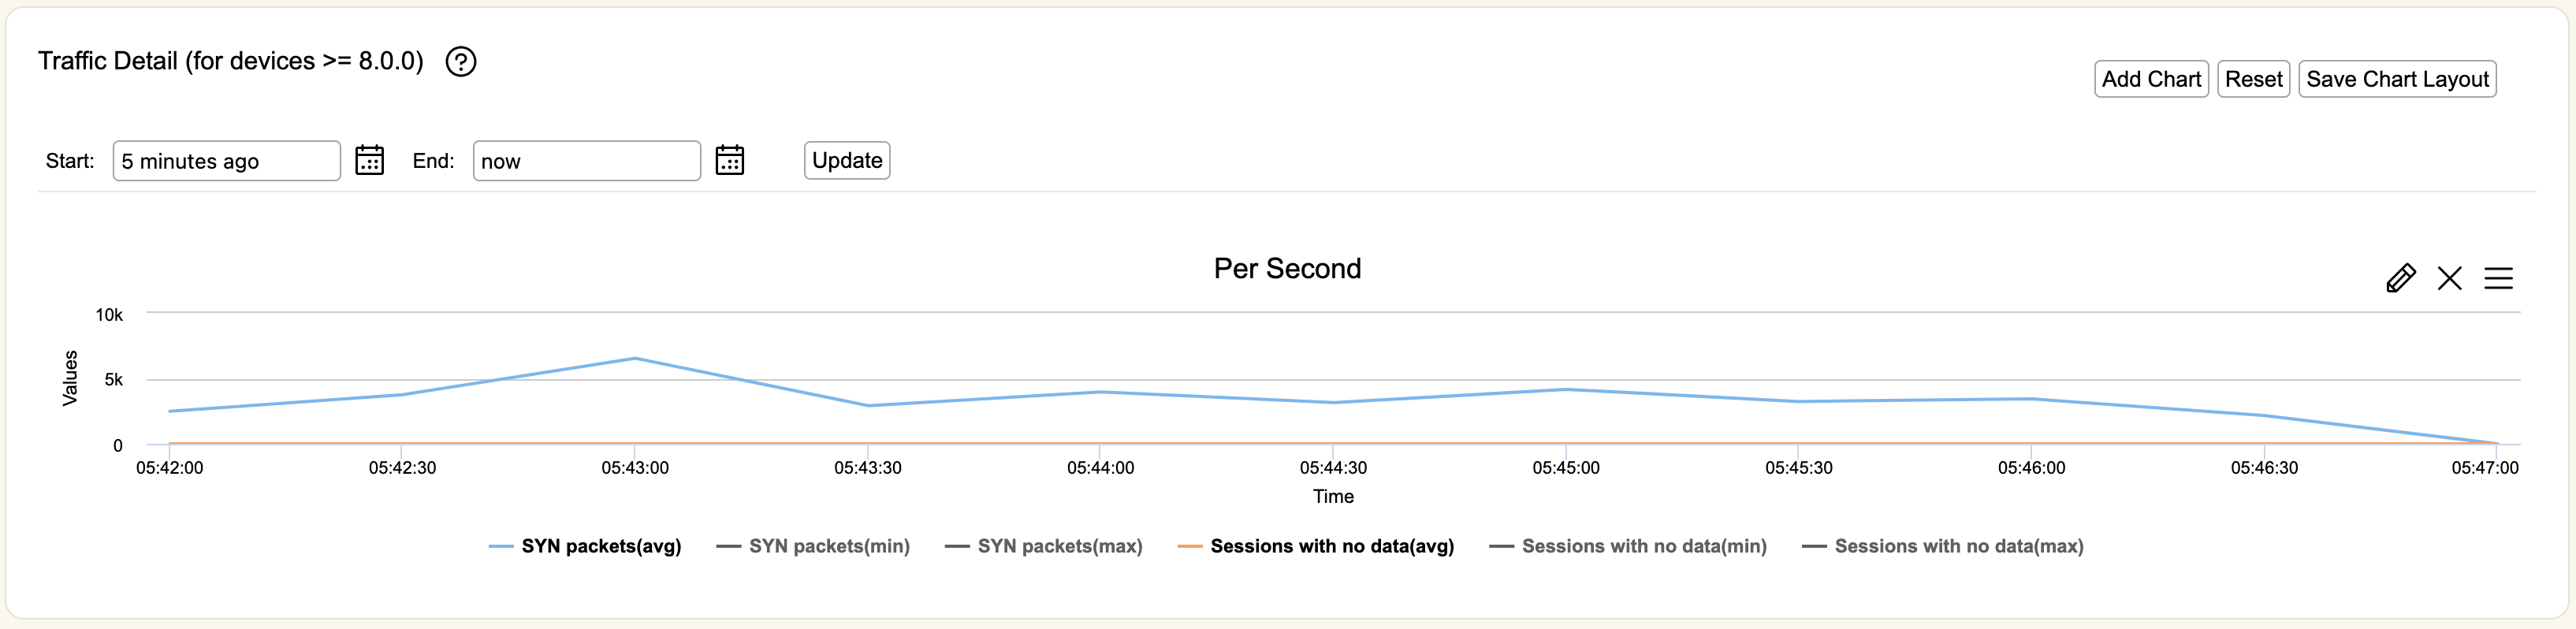
By default, this widget will be empty. Hitting Save Chart Layout will save the set of configured charts as default when first loading into a zone. Hitting Reset will revert the widget back to being empty when loading a zone for the current session.
Add Chart will create a new chart covering the same time period that can have different traffic categories (covered in the next section) selected.
Start and End are the times used to create the charts. You can use the icon to select a specific date and time, or you can write an entry in the format "X year/month/week/day/hour/minute ago", or use "now" to indicate current time. You can use the mouse to click and drag on the chart to zoom in to sections of the chart without having to set a new time period. Click Reset Zoom to bring it back to the original settings.
Update will refresh the graphs if you have changed the Start or End settings. Graphs, by default, will refresh themselves based on the time period displayed and the number of ticks. The refresh time of the graph displayed will be listed above the graph area.
The four icons shown on a chart allow you to Edit (pencil icon), Maximize (window icon), Delete (cross icon), or Export (three bar icon) that chart. When using Export, you can immediately print the chart or export it to a variety of graphics formats.
Traffic Categories
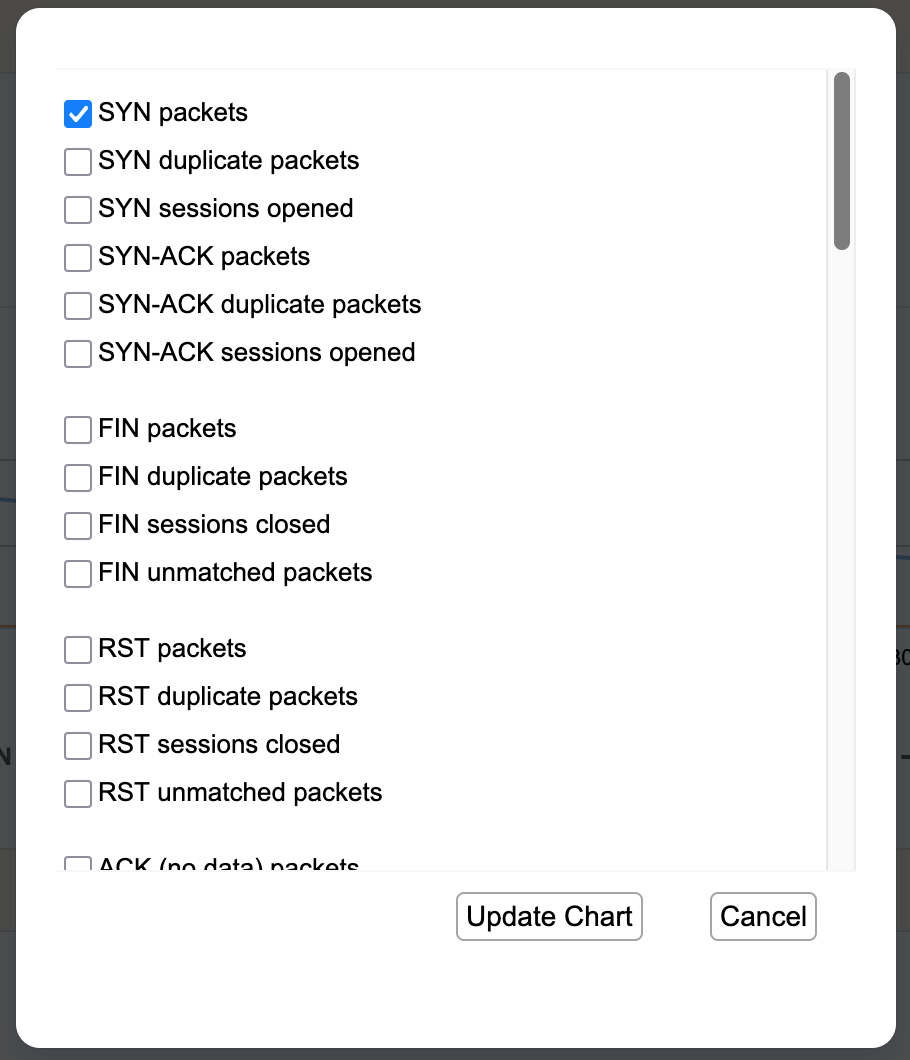
The different categories that are being tracked by AT8 can largely be broken down into the following sets:
- SYN and SYN-ACK Packets
- FIN Packets
- RST Packets
- ACK Packets
- Session and IP Behavior
This data represents what is being tracked by the AT8 algorithm as it processes zone traffic. This data may be different from what is represented by the zone traffic graphs, because other algorithms may be handling part of the traffic it is handed off to AT8. This will help when adjusting this algorithm as you are able to adjust your settings based on it what it sees, rather than having to make educated guess based on the larger patterns of traffic that are presented in the zone.
Data Aggregation
Each selected category will be presented three different ways: with the minimum, maximum, and average values for the given time period. These values will all be the same for short term data (previous 24 hours). In order to save on storage space, data is then aggregated across the following intervals, which can produce different min, max, and average values:
- Every 30 second window will be raw data over the previous 24 hours
- 5 minute windows over the previous 48 hours
- 1 hour windows over the previous 30 days
- 1 day windows over the previous 6 months