Prometheus Data Export
rWeb exports Prometheus compatible data for both rWeb application information (showing device versions, traffic and victim reporting, and active alerts), and the standard Prometheus Node Exporter information (for rWeb system health).
rWeb has a default landing page for both sets of metrics at https://your.rweb.address:8000/metrics, which may show additional metric exports in the future. The current sets of metrics available are:
/metrics/node- The standard Prometheus Node Exporter metrics referenced above./metrics/rweb- rWeb application metrics, described in more detail below./metrics/backend- rWeb backend metrics, which track the processes pulling data from configured RIOS devices and Directors.
Configuration
By default, rWeb exports its application metrics at https://your.rweb.address:8000/metrics/rweb. An example configuration in Prometheus would look like this:
- job_name: rweb-app-metrics
  honor_timestamps: true
  scrape_interval: 30s
  scrape_timeout: 10s
  metrics_path: /metrics/rweb
  scheme: https
  follow_redirects: true
  enable_http2: true
  static_configs:
  - targets:
    - your.rweb.address:8000
If you are running a cluster, and it is behind a load balancer (as discussed in the link), you can configure the target to point to the load balancer address, so that all data is scraped from the current primary. If you don't have a load balancer, add the address of both rWebs in your cluster to the 'targets' section. Only the primary will report all current traffic data, and the secondary will revert to only reporting its current running version but no other data. This ensures there's only one set of active traffic data available regardless of which rWeb is the primary.
If your Prometheus instance doesn't recognize the certificate your rWeb is currently configured to provide, you may also need to add some config to ignore the certificate:
# Under static config section from above
  tls_config:
    insecure_skip_verify: true
It is also recommended you secure port 8000 access from non-authorized sources.
Metrics
When scraped, rWeb provides the following data. This data is only updated every thirty seconds internally so you should not set your scrape_interval lower than 30s.
| Metric | Labels | Unit of Measure | Purpose |
|---|---|---|---|
rweb_version (Gauge) | version | 1 (static value) | Static value showing current rWeb Version using the label version |
rweb_rios_device_version (Gauge) | device_id, device_name, version | 1 (static value) | Static value mapping the device ID and rWeb display name with its current running version |
rweb_network_traffic_bps (Gauge) | category (In, Out, Clean, Attack, Monitored, Dropped), traffic_type (IPv6, IPv4), device_id, zone_id, zone_name, group_id, group_name | Bytes Per Second | Rate of network layer traffic by device/zone/group |
rweb_network_traffic_pps (Gauge) | category (In, Out, Clean, Attack, Monitored, Dropped), traffic_type (IPv6, IPv4), device_id, zone_id, zone_name, group_id, group_name | Packets Per Second | Rate of network layer traffic by device/zone/group |
rweb_transport_traffic_bps (Gauge) | category (In, Out, Clean, Attack, Monitored, Dropped), traffic_type (UDP, TCP, ICMP, Other), device_id, zone_id, zone_name, group_id, group_name | Bytes Per Second | Rate of protocol layer traffic by device/zone/group |
rweb_transport_traffic_pps (Gauge) | category (In, Out, Clean, Attack, Monitored, Dropped), traffic_type (UDP, TCP, ICMP, Other), device_id, zone_id, zone_name, group_id, group_name | Packets Per Second | Rate of protocol layer traffic by device/zone/group |
rweb_active_alerts (Gauge) | severity (alert, critical, error, warning, notice, informational, debug) | Number of Alerts | Number of active alerts by severity |
rweb_unacknowledged_alerts (Gauge) | severity (alert, critical, error, warning, notice, informational, debug) | Number of Alerts | Number of unacknowledged active alerts by severity |
rweb_victim_summary_bps (Gauge) | zone_id, zone_name, group_id, group_name, attack_type (text description of the attack type) | Bytes Per Second | Rate of bytes per second for each attack type (including hidden victims) for each zone/group |
rweb_victim_summary_pps (Gauge) | zone_id, zone_name, group_id, group_name, attack_type (text description of the attack type) | Packets Per Second | Rate of packets per second for each attack type (including hidden victims) for each zone/group |
rweb_active_victims (Gauge) | zone_id, zone_name, group_id, group_name, attack_type (text description of the attack type) | Number of Victims | Number of victims for each attack type (including hidden victims) for each zone/group |
rweb_zone_path (Gauge) | group_id, group_name, path_id,zone_id, zone_name | 1 (Static value) | The path_id is a comma seperated list representing the Zone's location in the Group tree from the owning group (group_id) up to the root (the Default Group with id 0). |
rweb_group_path (Gauge) | group_id, group_name, path_id | 1 (Static value) | The path_id is a comma seperated list representing the Group's location in the Group tree from the owning group (the first item in the list) up to the root (the Default Group with id 0). The Default Group, as the root of the tree, will have an empty string for path_id. |
rweb_rios_resource_limit (Gauge) | device_id, category (zone, prefix_v4, prefix_v6, blacklist_v4, blacklist_v6, blacklist_global_v4, blacklist_global_v6, src_whitelist_v4, src_whitelist_v6, src_whitelist_global_v4, src_whitelist_global_v6, dst_whitelist_v4, dst_whitelist_v6) | Number of configuration items | For the given device_id, this is the maximum number of items for each category that can be configured. This is the same information shown on the Zone Management page. |
rweb_rios_resource_usage (Gauge) | device_id, category (zone, prefix_v4, prefix_v6, blacklist_v4, blacklist_v6, blacklist_global_v4, blacklist_global_v6, src_whitelist_v4, src_whitelist_v6, src_whitelist_global_v4, src_whitelist_global_v6, dst_whitelist_v4, dst_whitelist_v6) | Number of configuration items | For the given device_id, this is the current number of items for each category that are configured. This is the same information shown on the Zone Management page. |
Caveats
- As mentioned above, a scraped secondary rWeb from a cluster will only report the
rweb_versionmetric. - A Zone that is configured without any routing prefixes will not report any of the
trafficmetrics, but will show up undervictimones. This is because rWeb maintains its own table for victim processing, and devices that are given a Zone with no routes will treat it as a no-op (to prevent using resources that won't apply to any current traffic). - For ease of use, both Zone and Group display names are embedded in most metrics. If the name is changed in rWeb, it will stop reporting the previous metric set (containing the old name) and start reporting the new one. This means if you want to observe continuous historical data, you should search by
zone_idorgroup_idlabels. In most cases the tuple of the two ID labels will not change, with the lone exception being move operations (transferring a Zone between groups). - The
victimmetrics will report against all attack types, 1-25 and 61-63 for all live Zones on rWeb. Even if only one victim type is present, all others will be reported with 0 values. If there are no victims, all values will be 0. - The
rweb_active_victimsmetric is reporting counts ignoring rWeb victim thresholds. This is equivalent to checking Show hidden victims when looking at the Victim Summary or Victim Tabs. - Deleting a Zone will cause all related metrics to stop being reported against that Zone (Device/Zone/Group labelset for
trafficmetrics and Zone/Group labelset forvictimmetrics).
Grafana
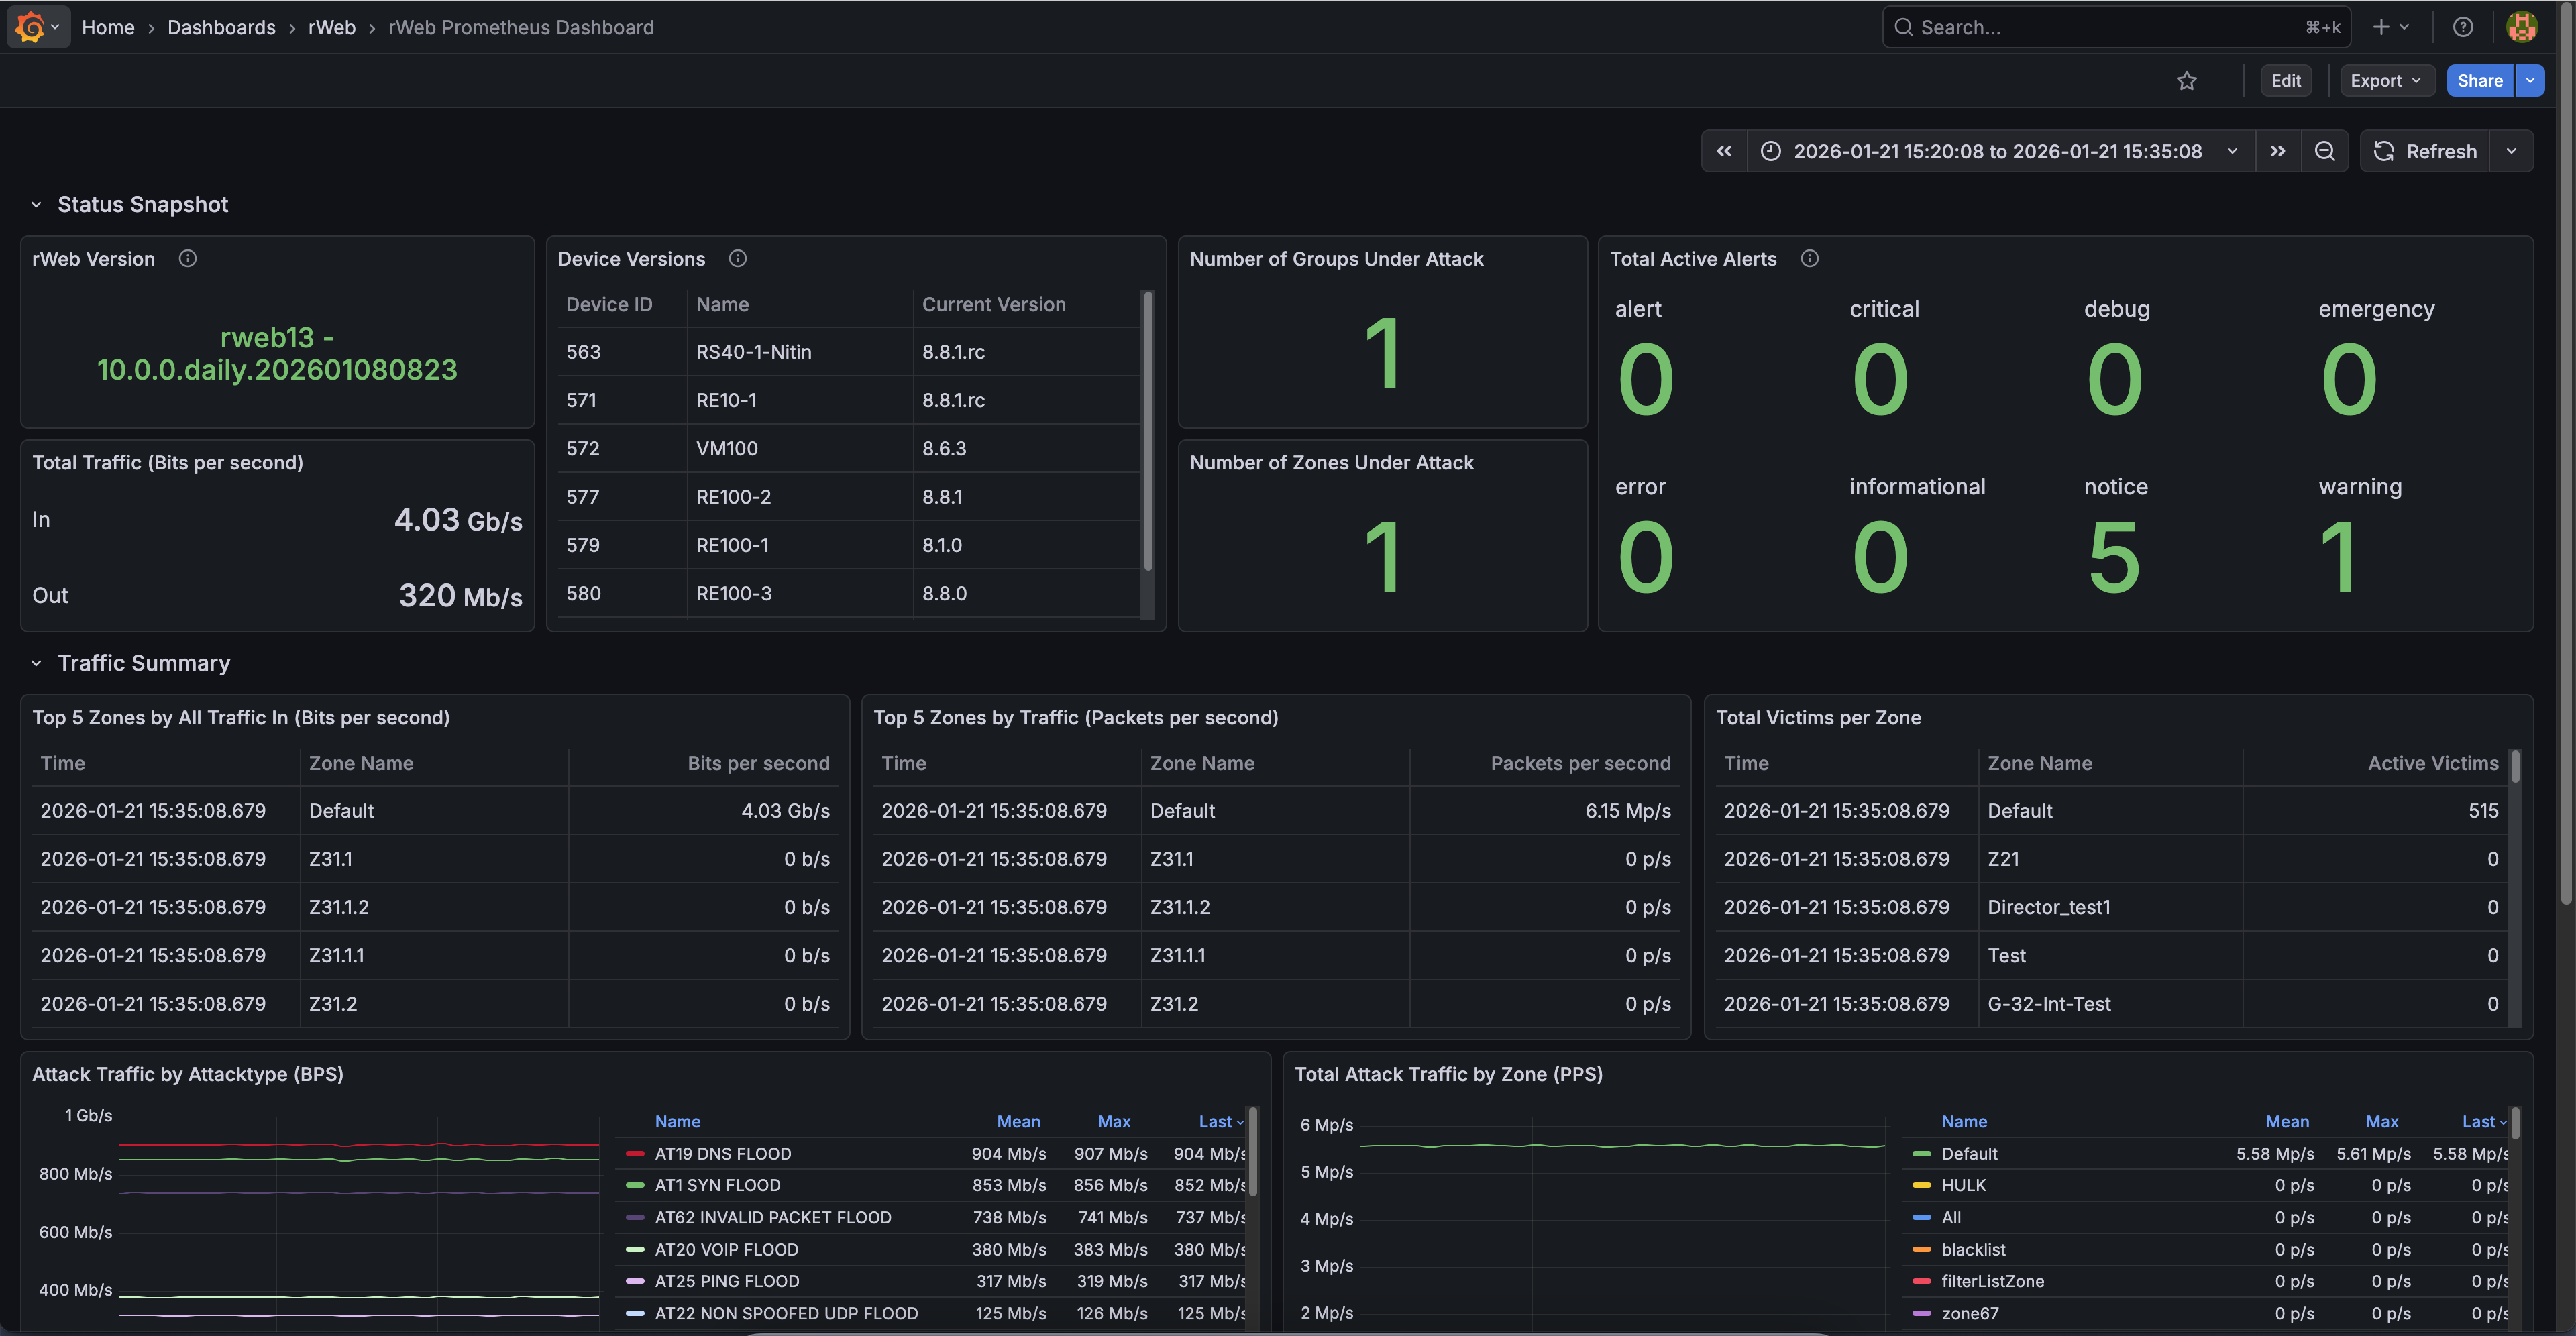
We have pre-built a few Grafana dashboards to show how to utilize this Prometheus data.
- A top level dashboard (shown above) that gives you a system level overview (.json file here).
- A drill down dashboard that lets you look at traffic for a given Group and/or Zones (.json file here).
- Another drill down dashboard, that utilizes the new
rweb_zone_pathandrweb_group_pathmetrics to present an aggregated view of traffic. Compared to the previous dashboard, a Group must be selected, and if the Zone dropdown is set to 'All' this will present aggregated traffic data for all Zones which have the selected Group as an ancestor or owner. Selecting 'Default - 0' (the Default group) for Group and 'All' for Zone thus presents the same data you would see on the main dashboard (total incoming traffic from every zone). (.json file here) - A device dashboard utilizing the new
rweb_rios_resource_limitandrweb_rios_resource_usagemetrics (.json file here).