Top Application
The Top Application section lets you view current or historical port usage under a variety of protocols based on statistical sampling.
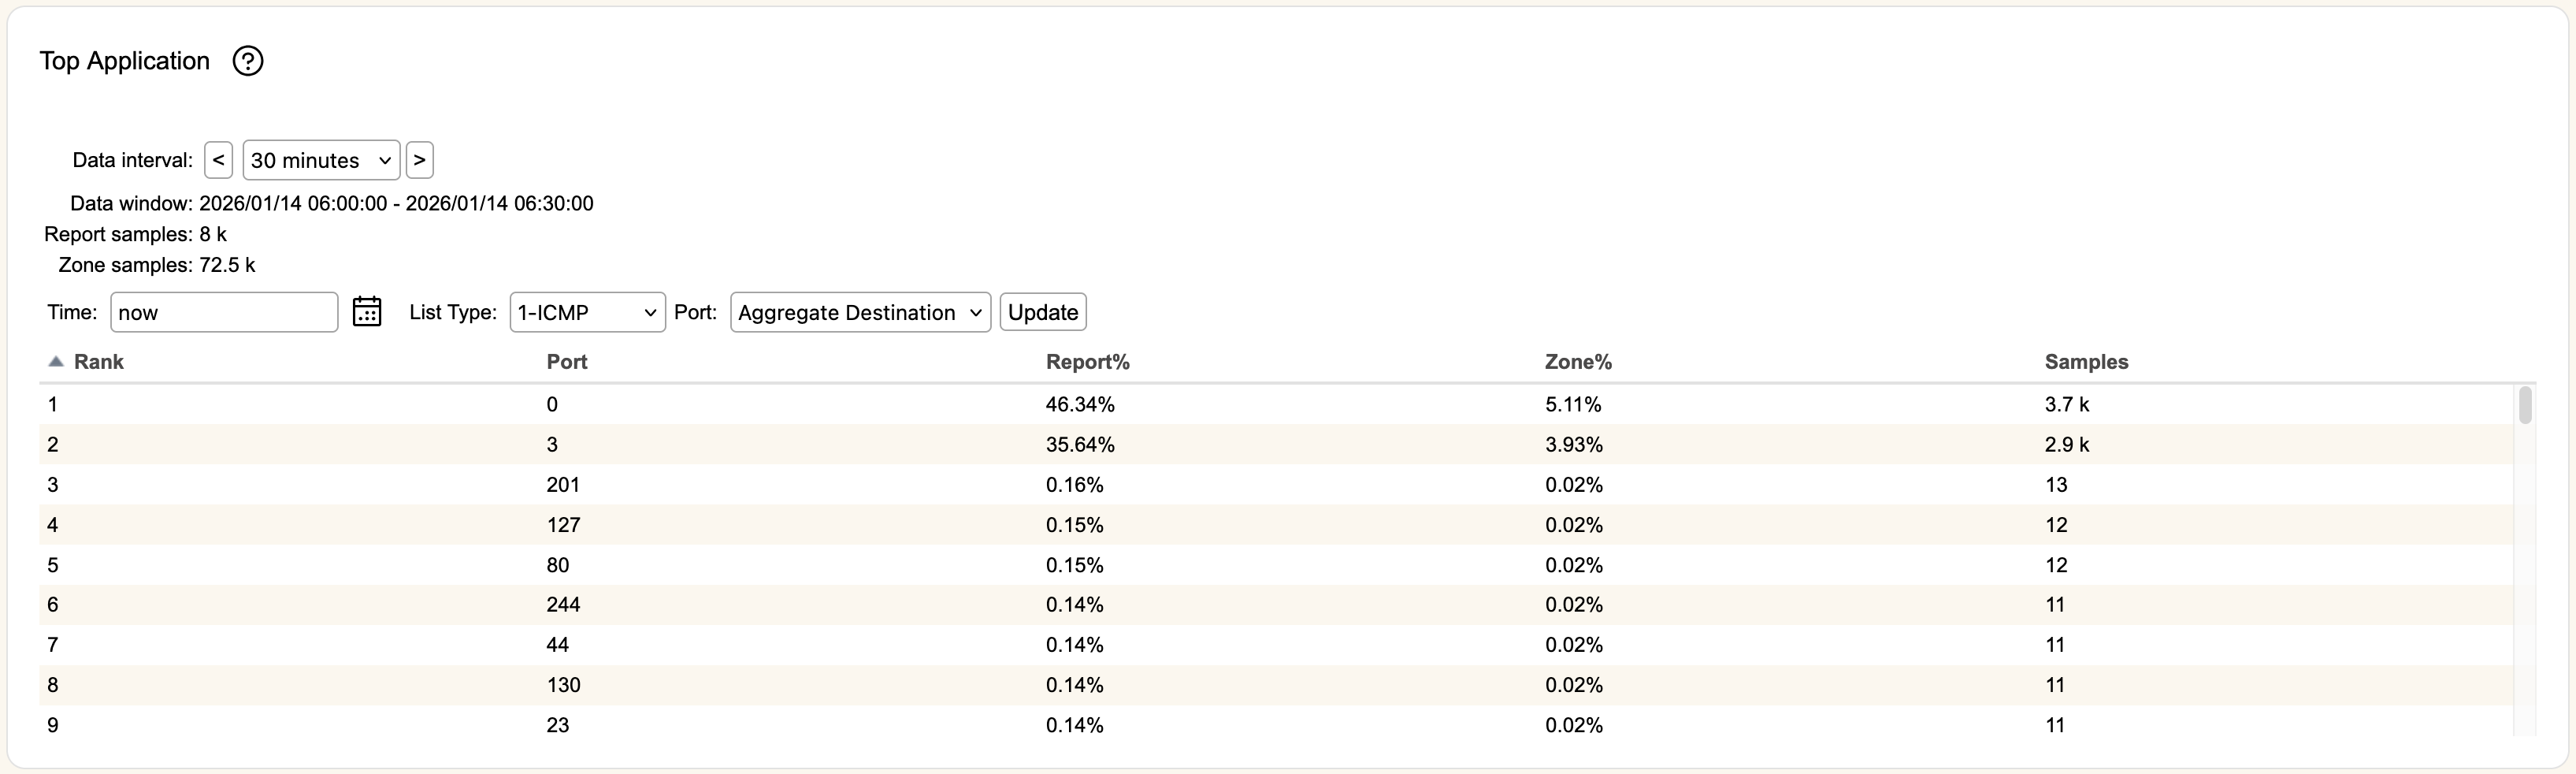
Data interval defaults to a 30 minute sampling window, but can be changed to 5 minute or 30 second reporting. Clicking the < or > buttons will increment or decrement the window in by the selected interval (versus entering a new timestamp in Rime), with its time range shown in Data window.
Time is the time period used to find data. You can use the icon to select a specific date and time, or you can write an entry in the format "X year/month/week/day/hour/minute ago", or use now to indicate current time. Once you've entered information, hitting Update will refresh the table.
In List Type, you can select from a number of protocols:
- ICMP- Internet Control Message Protocol (IPv4)
- TCP- Transmission Control Protocol
- UDP- User Datagram Protocol
- ICMPv6- Internet Control Message Protocol (IPv6)
- SCTP- Stream Control Transmission Protocol
The Port dropdown lets you select the displayed data, where Attack is for looking at samples flagged as attack only, Clean are samples not flagged as Attack, and Aggregate is the combination of both Attack and Clean samples. You can look at samples by either Source or Destination.
Rank rates the Port usage based on the amount of traffic during that reporting period, for the samples selected using the Port dropdown menu.
Report% and Zone% represents the amount of traffic represented by the Port within the selected protocol, reporting type, and zone.
The number of packets captured for each entry is shown in Samples.