Top List
The Top List section lets you view current or historical data for a number of metrics based on source or destination IP.
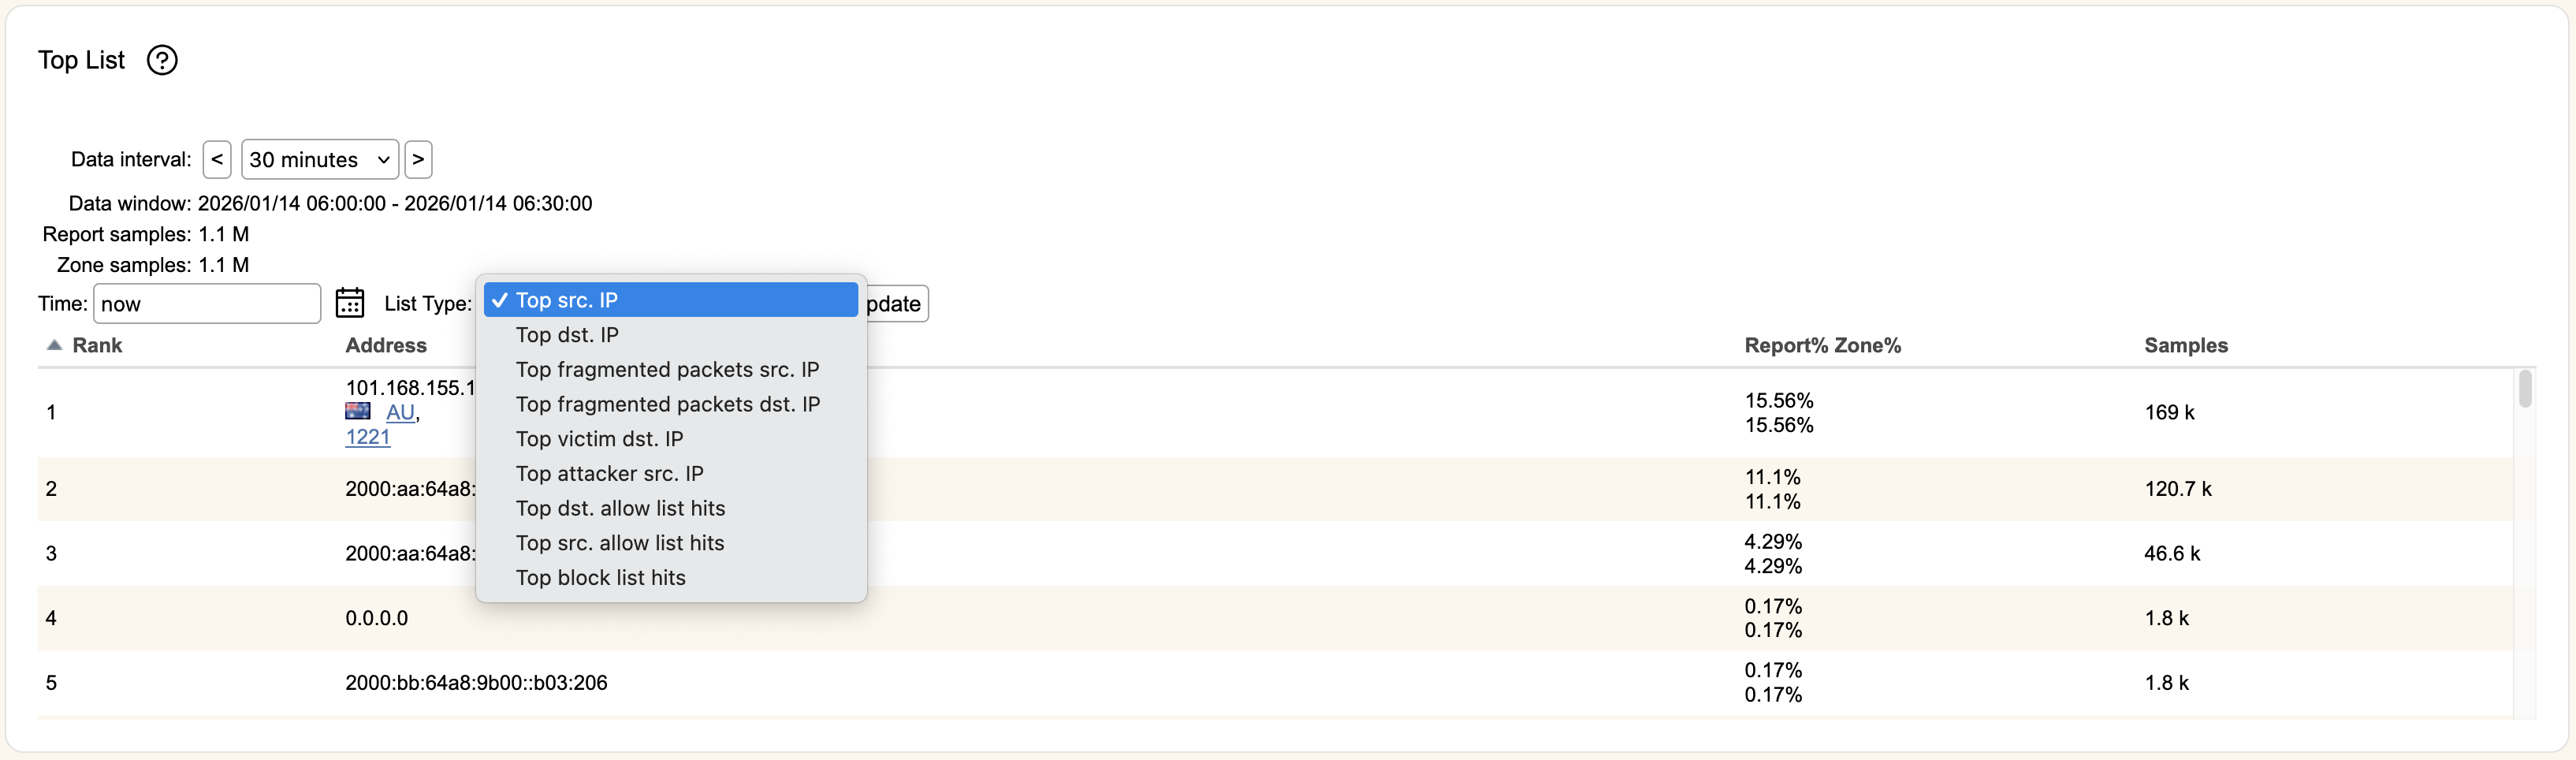
IP Addresses in the above image were synthetically generated.
Time is the time period used to populate this section. You can use the icon to select a specific date and time, or you can write an entry in the format "X year/month/week/day/hour/minute ago", or use now to indicate current time. Once you've entered information, hitting Update will refresh the table.
Data interval defaults to a 30 minute sampling window, but can be changed to 5 minute or 30 second reporting. Clicking the < or > buttons will increment or decrement the window in by the selected interval (versus entering a new timestamp in Time), with its time range shown in Data window.
In List Type, you can select a number of metrics to display:
- Top src. IP- The top source addresses.
- Top dst. IP- The top destination address.
- Top fragmented packets src. IP- The top source addresses sending fragmented packets.
- Top fragmented packets dst. IP- The top destination addresses receiving fragmented packets.
- Top victim dst. IP- The top addresses receiving the most attack traffic.
- Top attacker src. IP- The top addresses sending the most attack traffic.
- Top dst. allow list hits- The top allow listed destination addresses receiving the most traffic.
- Top block list hits- The top block listed source addresses that sent traffic.
- Top src. allow list hits- The top allow listed source addresses that sent traffic.
Each entry in the table will show the Rank of the IP address for the selected report, the Address information, Report% and Zone% representing the amount of traffic represented by the Address within the zone and selected report type, and the number of Samples captured for the Address.
You can click the blue hyperlinks under Address to view AS or CC information.